Figures & data
Figure 1. Quality control of EVs utilised for comparative NTA device analysis.
(a). Representative electron microscopy images of pooled EVs isolated by ultracentrifugation (10k or 100k x g fractions) from human serum or L-540 conditioned medium. 30k and 100k magnifications are shown. (b). Immunoblot analysis of EVs isolated by ultracentrifugation (10k or 100k x g fractions) from serum or L-540 conditioned medium and corresponding cell lysates using the indicated antibodies. Data are representative of three independent experiments (biological replicates) using pooled EV samples. (c). Flow cytometric analysis of EVs bound to polystyrene microspheres and stained for the indicated EV marker proteins and phosphatidylserine by annexin V staining in comparison to IgG1 isotype control. Data are representative of three independent experiments (biological replicates) using pooled EV samples. (d). SP-IRIS immunophenotypic analysis by the multiplexed microarray ExoView of EVs isolated by ultracentrifugation (10k or 100k x g fractions) from serum or L-540 conditioned medium. EV samples were incubated with microarray chips coated with the indicated antibodies. Images of scattered light were taken (Supplemental Figure 1) and analysed regarding total EV number (captured EVs) or stained with the indicated fluorescent detection antibodies to count EVs expressing either CD9, CD63 or CD81 in addition to the marker used for capturing (EVs co-expressing CD9, CD63 or CD81). The error bars represent the SD from at least three technical replicates measuring pooled serum EVs (donors n = 3) and pooled L-540 EVs (independent EV isolations n = 3). The experiment has been performed twice at different time points using the same sample pool.
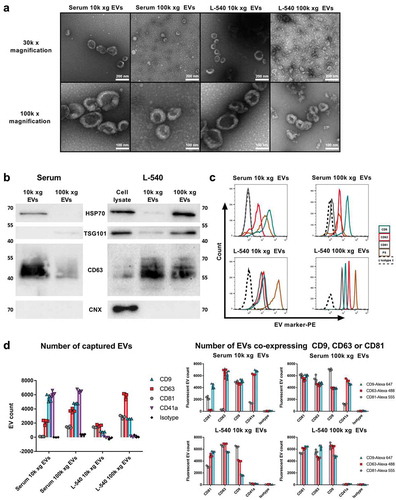
Figure 2. Device-dependent size determination of synthetic and biological samples.
Particle size distributions (PSDs) obtained by NanoSight NS300 (orange), ZetaView (blue), TEM (black) or ExoView [CD9 (cyan), CD63 (red) and CD81 (grey)] of different synthetic particle types (polystyrene or silica nanospheres and liposomes) and biological EVs isolated by ultracentrifugation (10k and 100k xg EVs from serum or L-540 cells) are depicted in . The particle size distribution overlays (left-hand side) combine and summarise all methods applied (NTA, TEM and SP-IRIS) for the respective samples. The TEM size distribution of polystyrene and silica nanospheres was plotted based on the manufacturers’ specifications (dashed filled area). Values of completed tracks for PSDs by NTA (CT), counted particles (CP) for TEM and ExoView PSDs and bin width of histograms are indicated, and graphs are representative for measuring samples using the optimal particle/frame rate according to the operating manual for each device (20–100 particles/frame for NanoSight NS300 and 140–200 particles/frame for ZetaView). Individual histograms of size distributions from NTA data comparing NanoSight NS300 and ZetaView, quantifications by TEM and ExoView data are shown. Standard deviations obtained from the size distributions comparing NanoSight NS300 and ZetaView are provided in Supplemental Figure 2.
![Figure 2. Device-dependent size determination of synthetic and biological samples.Particle size distributions (PSDs) obtained by NanoSight NS300 (orange), ZetaView (blue), TEM (black) or ExoView [CD9 (cyan), CD63 (red) and CD81 (grey)] of different synthetic particle types (polystyrene or silica nanospheres and liposomes) and biological EVs isolated by ultracentrifugation (10k and 100k xg EVs from serum or L-540 cells) are depicted in Figure 2. The particle size distribution overlays (left-hand side) combine and summarise all methods applied (NTA, TEM and SP-IRIS) for the respective samples. The TEM size distribution of polystyrene and silica nanospheres was plotted based on the manufacturers’ specifications (dashed filled area). Values of completed tracks for PSDs by NTA (CT), counted particles (CP) for TEM and ExoView PSDs and bin width of histograms are indicated, and graphs are representative for measuring samples using the optimal particle/frame rate according to the operating manual for each device (20–100 particles/frame for NanoSight NS300 and 140–200 particles/frame for ZetaView). Individual histograms of size distributions from NTA data comparing NanoSight NS300 and ZetaView, quantifications by TEM and ExoView data are shown. Standard deviations obtained from the size distributions comparing NanoSight NS300 and ZetaView are provided in Supplemental Figure 2.](/cms/asset/aad6d206-288a-4ceb-be16-6ed511513aff/zjev_a_1596016_f0002_oc.jpg)
Figure 3. Concentration and size measurements of synthetic nanospheres comparing NanoSight NS300 and ZetaView.
Concentration measurements (a) or size measurements (b) of polystyrene and silica nanospheres acquired with NanoSight NS300 or ZetaView. Measurements of the same dilution were performed using the optimal particle/frame rate according to the operating manual for each device (20–100 particles/frame for NanoSight NS300 and 140–200 particles/frame for ZetaView). Each measurement results from 5 one-minute videos (NanoSight NS300) or the mean of 11 cell position records (ZetaView). The average of completed tracks (CT), the coefficient of variation (% CV, precision) and the measurement bias (% BIAS, accuracy) are indicated. The dashed lines indicate the calculated sphere concentration of the stock solution (polystyrene nanospheres 1.86E+13 #/ml; silica nanospheres 1.00E+13 #/ml) in (a) and the particle size as stated by the manufacturer in (b). Mean and SD of three technical measurements are shown.
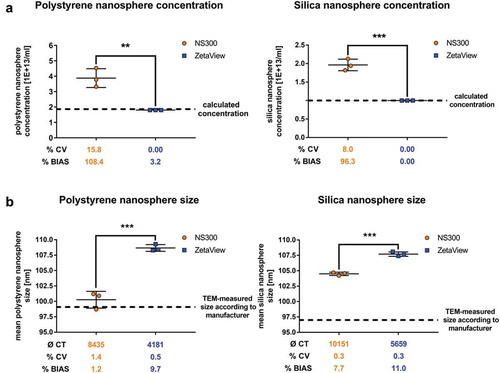
Figure 4. Concentration and size measurements of liposomes and biological EV preparations comparing NanoSight NS300 and ZetaView.
Concentration measurements (a) or size measurements (b) of liposomes or EVs isolated by ultracentrifugation (10k and 100k x g fractions) from serum or L-540 cell culture supernatants. Measurements were performed using the optimal particle/frame rate according to the operating manual for each device (20–100 particles/frame for NanoSight NS300 and 140–200 particles/frame for ZetaView). Each measurement results from five 1-min videos (NanoSight NS300) or the mean of 11 cell position records (ZetaView). The average of completed tracks (CT), the coefficient of variation (% CV, precision) and the measurement deviation from TEM (% DTEM) are indicated. Horizontal dashed lines indicate the mode of particle size from TEM measurements of the respective samples. Mean and SD of three technical measurements are shown.
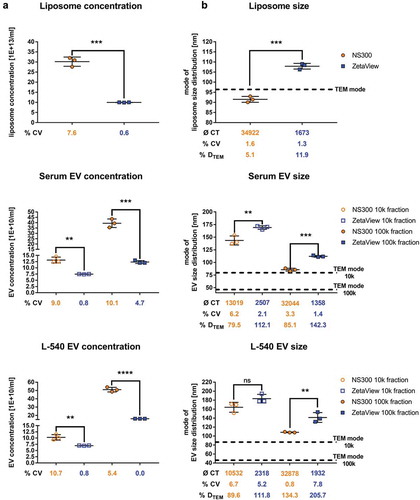
Figure 5. Serial dilution concentration measurements of liposomes and biological EV preparations.
Concentration measurements (a) or size measurements (b) of serially diluted liposomes or serially diluted EVs isolated by ultracentrifugation (100k x g fractions) from serum or L-540 cell culture supernatants using NanoSight NS300 and ZetaView. The starting EV concentration was chosen at the highest end of the optimal settings range to analyse as many dilution steps with optimal settings as possible. Solid lines depict expected linear regression models and goodness-of-fit is indicated as the coefficient of determination (R2) and the root-mean-square error (RMSE). The measurement bias (%BIAS, accuracy) is indicated for concentrations measurements in (a) and the number of completed tracks (CT) is indicated for size measurements in (b). Mean and SD of three technical measurements are shown. The experiment has been performed twice at different time points using different sample pools.
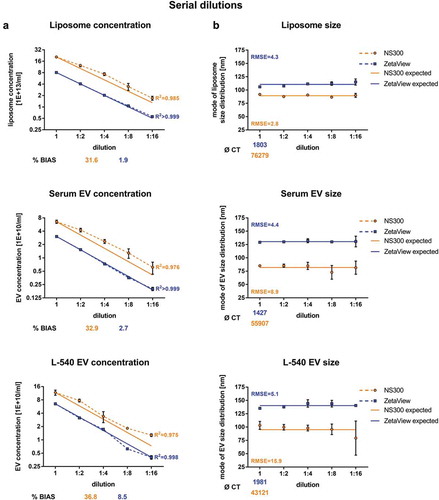
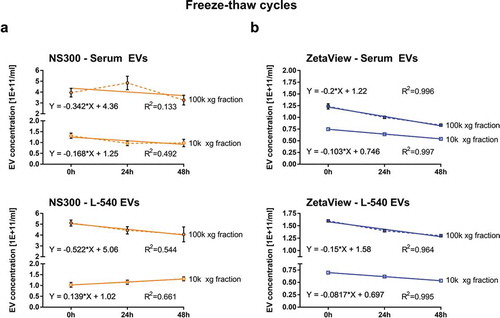
Figure 6. Measurement of freeze-thaw-cycle-dependent EV concentration.
Particle concentration measurements of EVs isolated by ultracentrifugation (10k and 100k x g fractions) from serum or L-540 conditioned medium before and after 1. and 2. freeze-thaw-cycles using NanoSight NS300 (a) and ZetaView (b). One freeze-thaw-cycle consisted of 23.5 h at −80°C followed by 30 min thawing on ice before measurement. Depicted are the mean and SD of three technical measurements. The experiment has been performed twice at different time points using different sample pools.