Figures & data
Figure 1. CD63 and ALIX positive protrusions in the cytoplasmic border of migrating colorectal cancer cells (a-b) show the same cytokeratin (CK, green) positive migrating CRC cell. (b) shows granular CD63 (red) protein expression in the cortical cytoplasm. Scale bars: 50 μm (a) and 10 μm (b). (c) 3D reconstruction of the same cell as in (a) and (b). CD63 positive structures are present either partially outside of the cytoplasm (arrowhead) or covered with a thin CK positive layer (white box). (d and e) ALIX (red)/CK (green) co-immunostaining in another migrating CRC cell. Scale bars: 50 μm (d) and 10 μm (e). (f) shows a 3D reconstruction of the cell same as in Figure 1(d) and 1(e) with ALIX positive structures (red) which are partially (asterisk) or completely (arrowhead) outside of CK positive cytoplasm.
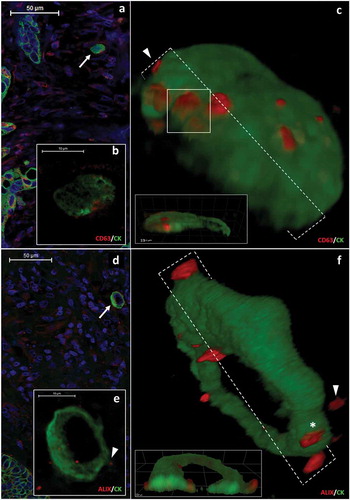
Figure 2. Morphology and size distribution of ALIX/CD63 positive sEVs and sEVCs in CRC tissue. (a) Violin plot shows the diameter distribution of extracellular sEVCs (left) and distinguishable ALIX-positive spheroids inside and close to the sEVCs (right) (measured with Pannoramic Viewer 1.15.3 and Leica LAS X 3.1.1 software). (b) Comparison of the diameters of the at least partially extracellularly localized ALIX/CD63 positive structures in migrating CRC cells. (c) Comparison of the diameters of similarly localized CD63-positive structures in CRC tissues and in HT29 culture. (d) Average number of the at least partially extracellular ALIX-positive or CD63-positive signals in migrating CRC cells (tissue). (e) Average number of intracellularly localized ALIX-positive or CD63-positive signals in migrating CRC cells (tissue). B-E shows mean±S.D. of n = 40 cells. HyVolution (f) and STED (g) microscopic images of an ALIX positive (red) sEVC (white box) which is partially embedded within the CK positive cytoplasm (green) of the migrating CRC cell. Scale bars: 5 μm and 2 μm respectively. (h) Fluorescence intensity profile of ALIX positive sEVC (red) crossed by a selected line (green). Scale bar: 1.5 μm. (i) Fluorescence intensity profile and measured Full-Width at Half-Maximum (FWHM) values of a small group ALIX positive sEVs and (j) a single ALIX positive sEV. Scale bars: 0.2 µm and 0.15 μm (200 nm and 150 nm) respectively. FWHM values: 141 and 149 nm, respectively.
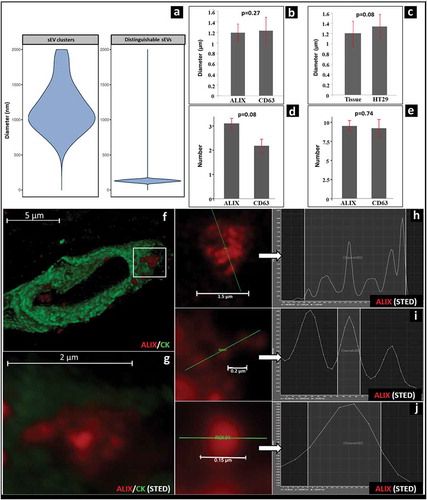
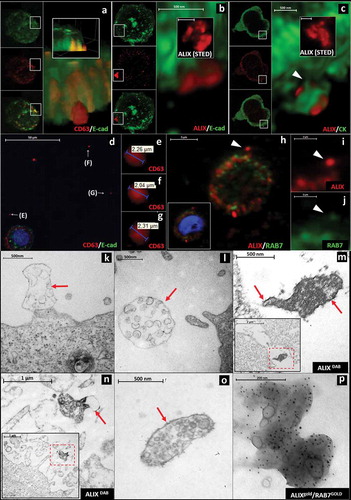
Figure 3. Visualization of extracellular sEVCs in HT29 colorectal carcinoma cell line (a) Confocal (CD63: red, E-cadherin: green), (b) HyVolution (ALIX: red, E-cadherin: green) and (c) HyVolution (ALIX: red, CK: green) images of HT29 cell-derived sEVCs. Arrowhead points to a cytoplasmic process in C. Scale bars: 500 nm. The inserts of (b) and (c) show STED microscopic images of the sEVCs (scale bars: 500 nm). (d–g) sEVCs in cell-free regions of HT29 culture. Scale bar: 50 µm (d). (h-j) ALIX/RAB7 co-staining of extracellular MVB-like sEVCs (arrowheads; scale bars: 5 µm (h), 2 µm (i and j)). (k, l) EM images show MVB-like sEVCs as large, membrane enclosed (arrows) structures close to the cell with internal vesicles in the size range of sEVs (~100–160 nm). Scale bars: 500 nm. (m, n) Membrane enclosed (arrows) MVB-like sEVCs contain ALIX positive (DAB staining) spheres close to HT29 cells (inserts). Scale bar: 500 nm and 1 µm, respectively, inserts: 2 µm and 1 µm respectively. (o) A membrane enclosed (arrow) MVB-like sEVC and (p) an ALIX (5 nm gold)/RAB7 (9 nm GOLD) positive MVB-like sEVC isolated from the conditioned media of HT29 cells. Scale bars: 500 nm and 200 nm, respectively.