Figures & data
Figure 1. Schematic overview of the workflow of the study. Conditioned media from PC-3 and VCaP cells grown in cell culture flasks or in bioreactors were harvested for extracellular vesicles (EVs) by differential ultracentrifugation as 20K and 110K subpopulations. The isolated EVs were characterized by nanoparticle tracking analysis (NTA), electron microscopy (EM) and Western blotting, and the EV samples were submitted to non-targeted metabolomics (liquid chromatography mass spectrometry, LC–MS). Respective media controls for metabolomic profiling were incubated without cells at 37°C for 72 h and processed by ultracentrifugation similarly as the 110K EV samples. CM, conditioned media; RP, reverse phase; HILIC, hydrophilic interaction liquid chromatography.
Figure 2. (a) The average particle concentrations (particles/ml in log10 scale) of the 20K and 110K C-EVs and BR-EVs derived from PC-3 and VCaP cell cultures measured with NTA (n = 3). (b) Combined NTA data of size distributions from three isolations of the 20K and 110K C-EVs and BR-EVs derived from PC-3 and VCaP cell cultures. Mean sizes (nm ±SD) of the EVs are indicated in the figure. Statistical analysis of the size distribution data is shown in Supplementary Table 1. Concentration of BR-EVs in primary axis and C-EVs in secondary axis. C-20K is the 20,000 g EV pellet isolated from the conventional flasks, C-110K is the 110,000 g EV pellet from the conventional flasks, BR-20K is the 20,000 g EV pellet from the bioreactor, BR-110K is the 110,000 g EV pellet from the bioreactor.
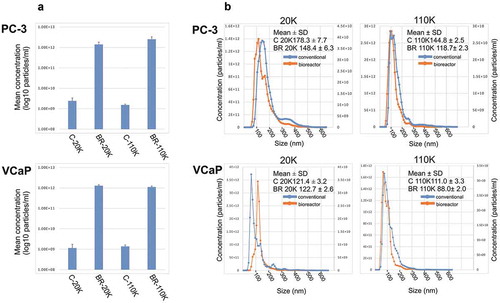
Figure 3. (a) Principal component analysis (PCA) of the metabolite molecular features according to the experimental conditions analysed with LC-MS. For PCA, the metabolites of the 20K and 110K EVs of both cell culture conditions, as well as all four media controls, were merged. Data points represent the average values of three isolations. (b) VENN diagrams of the identified metabolites from the conditioned media collected from PC-3 and VCaP cell lines. (c) VENN diagrams of the identified metabolites from the media controls. C-20K is the 20,000 g EV pellet from the conventional flasks, C-110K is the 110,000 g EV pellet isolated from the conventional flasks, BR-20K is the 20,000 g EV pellet from bioreactor, BR-110K is the 110,000 g EV pellet from bioreactor. BR-medium and C-medium are the media controls from the bioreactors and conventional cell culture flasks, respectively.
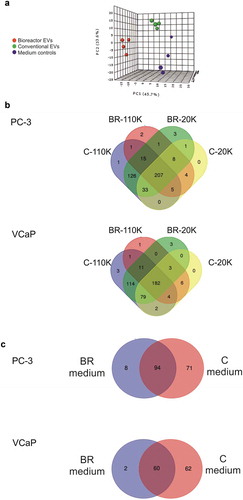
Figure 4. Heat map showing the metabolites grouped by the K-means clustering method constructed on the basis of importance for the 20K and 110K EVs of culture conditions and cell lines. The standardized group mean values are shown. Values were standardized by mean of all samples and standard deviation: Standardized Value = [(Value) – Mean(of all samples)]/Standard deviation(of all samples).
![Figure 4. Heat map showing the metabolites grouped by the K-means clustering method constructed on the basis of importance for the 20K and 110K EVs of culture conditions and cell lines. The standardized group mean values are shown. Values were standardized by mean of all samples and standard deviation: Standardized Value = [(Value) – Mean(of all samples)]/Standard deviation(of all samples).](/cms/asset/c6b7272d-454b-4606-80dd-ce60f70079ac/zjev_a_1596669_f0004_oc.jpg)
Figure 5. Simplified diagram of the downregulated metabolic pathways of phosphatidylethanoloamine (PE), phosphatidylcholine (PC) and sphingomyelin (SM) lipid synthesis in the EVs derived from the bioreactors (BR-EVs). Metabolites that were downregulated in all the BR-EVs from both cell lines in comparison to the metabolites from all the C-EVs, are highlighted in red. The metabolites belonging to the Kennedy pathway are underlined.
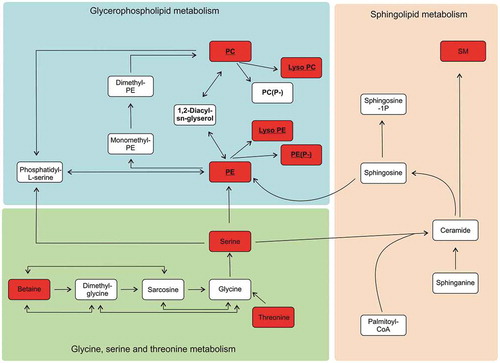
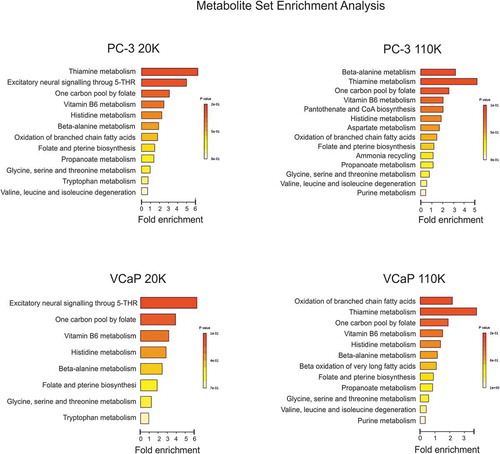
Figure 6. Metabolic pathway analysis of the enrichment of the unique metabolites found in the C-EVs (20K and 110K) which were absent in the BR-EVs. Summary plots of the Metabolite Set Enrichment Analyses (MSEA) of PC-3 C-20K versus BR-20K and C-110K versus BR-110K, and of VCaP C-20K versus BR-20K and C-110K versus BR-110K. Metabolites are ranked according to the p-value.