Figures & data
Figure 1. NanoFACS configuration.
Diagram showing the Beckman Astrios EQ optics configuration and noise sources at the stream:laser intersect. The characteristic plane of scattered light at the level of the laser intercept is blocked by the obscuration bar, while the diffusely scattered light is not.
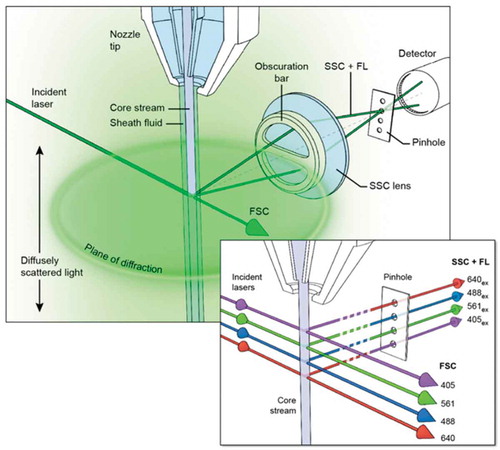
Figure 2. Determination of the triggering parameters that enhance the signal to reference noise separation of beads and EVs.
(a) Reference noise, 100, 200 and 500 nm polystyrene bead analysis by nanoFACS, in its optimal configuration with a 561-SSC trigger. (b) Separation index of Noise and 100 nm beads in multiple channels of analysis (x axis) following different triggers (488-SSC dark blue, 561-SSC green and 488-Fluorescence light blue). Triggering channels were not used to analyse the separation index of the same channel (n.e.; not examined). (c) Contour plots of PBS, unstained DC2.4 EVs, and CFSE-stained DC2.4 EVs analysed by nanoFACS. X-axes are calibrated to molecules of equivalent soluble fluorophore (FITC), representative regression for axis conversion can be found in . Gating of noise, histograms of side scatter and FITC MESF, and the reproducibility of staining can be seen in Supplementary Figure 2a, b. (d) DC2.4 EV concentration obtained by spiking counting beads in the sample and using different channel triggers to determine the best trigger for particle enumeration. (e) DC2.4 diameter distribution obtained using nanoparticle tracking analysis. (f) comparison of unstained DC2.4 EV enumeration using nanoparticle tracking analysis and nanoFACS using spike-in beads. Error bars show the full range of obtained concentration with five replicates on Astrios EQ and 3 replicates using nanoparticle tracking analysis. Gating strategy for counting unstained DC2.4 EVs can be seen in Supplementary Figure 2c. Red boxes highlight system noise.
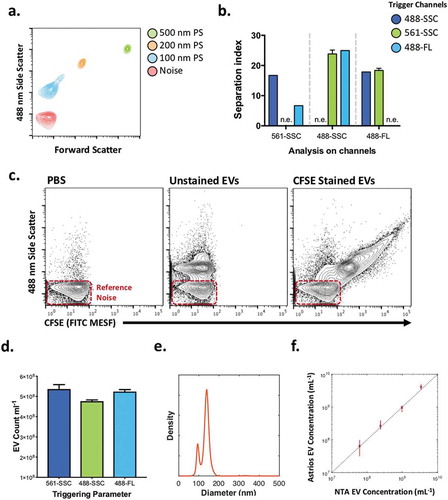
Figure 5. Phenotyping of MHCII+ and PSMA+ EVs.
(a) Comparison of unstained and PSMA-stained PC3pip EVs and unstained and MHC II-stained BMDC EVs using FITC-conjugated fluorophore (top) and PE-conjugated fluorophore (bottom) with axes normalised to molecules of equivalent fluorophore. Red boxes highlight system reference noise. (b) Mean diameter distributions of PC3pip- and BMDC-EVs using nanoparticle-tracking analysis. (c) Regression curves for converting arbitrary unit axes to MESF values for PE (left) and FITC (right).

Figure 3. Immune and tumour-derived EV sorting of fluorescently labelled EVs.
(a) Representative dot plots of PBS and mixed 4T1 and DC2.4 EVs (b) Presort dot plots of PBS and mixed EVs (top), post-sort reanalysis of DC2.4 EVs and 4T1 EVs (bottom). Red boxes highlight system noise. Sort gating strategy can be found in Supplementary Figure 2d. (c) Summary of gate quadrant events from highlighting sort efficiency, lack of coincidence detection, and percentage purity (d) Western Blot validation of unsorted DC2.4- and 4T1-EVs. (e) Diameter distributions of DC2.4- and 4T1-EVs using nanoparticle-tracking analysis. (f) TEM of unsorted DC2.4 EVs.
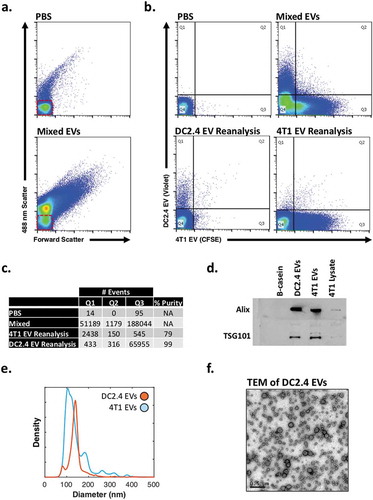
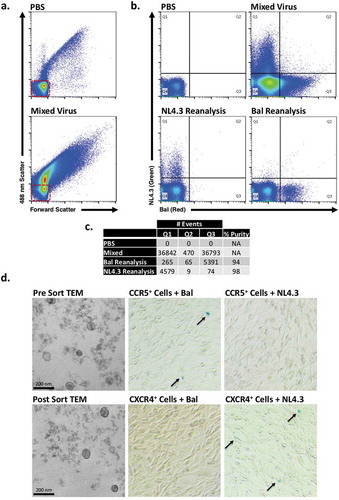
Figure 4. NanoFACS sorting and re-analysis of HIV.
(a) Representative dot plots of PBS and mixed virus scattering. (b) Presort dot plots of PBS and mixed virus (top), post-sort reanalysis of NL4.3 virus and Bal virus (bottom). (c) Summary of gate quadrant events from highlighting sort efficiency, lack of coincidence detection, and percentage purity. Red boxes highlight system noise. (d) Shows electron micrographs with representative pre- (top left) and post- (bottom left) nanoFACS sorted viral material, demonstrating characteristic viral features (immature and mature virus particles are visible, as well as well-defined cone-shaped core structures). Microscopy shows that nanoFACS sorted virus from specifically infects only the cell line expressing the appropriate co-receptor for the respective sorted viral population. HIV-1 Bal (CCR5-tropic) stained with PKH26 and HIV-1 NL4.3 (CXCR4-tropic) stained with PKH67 were sorted apart from one another and titred on reporter U373-MAGI-CCR5 and U373-MAGI-CXCR4 cells, which show β-Gal (blue) staining when infected (arrows). Sorted CCR5-tropic Bal viral particles infect cells expressing CCR5 (top middle), but not cells expressing CXCR4 (bottom middle). Sorted NL4.3 does not infect cells expressing CCR5 (top right) but does infect cells expressing CXCR4 (bottom right).