Figures & data
Figure 1. Characterization of exosomes isolated from N-Myc amplified and non-amplified neuroblastoma cells.
(a) Western blot analysis of exosomal enriched proteins Alix and TSG101 in fractions obtained from OptiPrep density gradient centrifugation (SK-N-BE2 cells). TSG101 and Alix were enriched in fractions 7 and 8 corresponding to the buoyant density of 1.13 and 1.15 g/mL. (b) Western blot analysis representing the presence of Alix and TSG101 that are enriched in exosomes derived from SH-SY5Y cells. Fraction 7 contained a high abundance of Alix and TSG101. (c) TEM images of exosomes isolated by OptiPrep density gradient centrifugation suggested the presence of vesicles. (D) Venn diagram representing proteins present in exosomes derived from N-Myc amplified (SK-N-BE2) and non-amplified (SH-SY5Y) neuroblastoma cells. A total of 749 proteins are found to be common between the exosomes isolated from the two neuroblastoma cell lines. (e) Venn diagram depicting differentially abundant (>2-fold) proteins in SK-N-BE2 and SH-SY5Y cell-derived exosomes. A total of 581 proteins were enriched in exosomes derived from SK-N-BE2 cells compared to the exosomes from SH-SY5Y cells. Similarly, a total of 385 proteins were enriched in exosomes isolated from SH-SY5Y cells. The red arrow represents proteins that are of high abundance in SK-N-BE2 cell-derived exosomes compared SH-SY5Y cell-derived exosomes. Green arrow represents proteins that are of lower abundance in SK-N-BE2 cell-derived exosomes compared SH-SY5Y cell-derived exosomes.
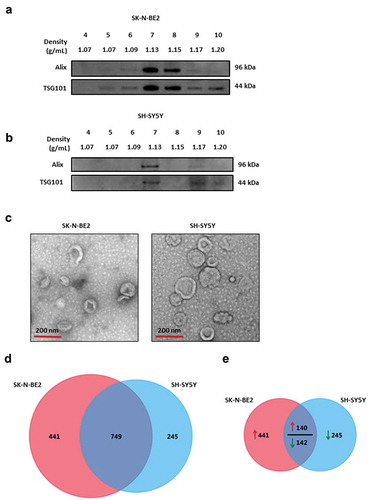
Figure 2. Proteomic analysis of SK-N-BE2 cell-derived exosomes are enriched with exosomal and signalling proteins.
(a) Heatmap of exosomal enriched proteins identified in exosomes isolated from neuroblastoma cells. Alix (PDCD6IP) was highly enriched in both the exosomal samples. (b) RAB proteins were differentially abundant in exosomes isolated from SK-N-BE2 and SH-SY5Y cells. RAB10, RAB14, RAB1B, RAB5C and RAB7A were detected in both the exosomal samples in high abundance. (c) The abundance of integrins in exosomes isolated from SK-N-BE2 and SH-SY5Y cells. (d) Western blotting based validation of proteins found in exosomes secreted from N-Myc amplified and non-amplified neuroblastoma cells. WCL = whole cell lysates. (e) FunRich based enrichment analysis of signalling pathways enriched in proteins differentially abundant in SK-N-BE2 and SH-SY5Y cell-derived exosomes. * denotes p < 0.05, ** denotes p < 0.01 and *** denotes p < 0.001 as determined by hypergeometric test.
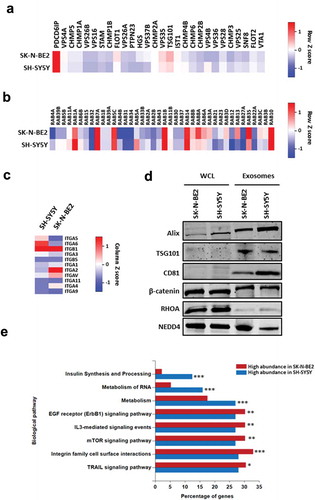
Figure 3. Exosomes derived from SK-N-BE2 cells induce migration in SH-SY5Y cells.
(a) Colony forming abilities of SH-SY5Y cells treated with and without exosomes. SH-SY5Y cells (200 cells per well) were incubated with 10 µg/mL of exosomes isolated from SK-N-BE2 and SH-SY5Y cells. The SH-SY5Y cells in the presence of SK-N-BE2 cell-derived exosomes showed a significant increase in colony forming ability (n = 3). (b) Transwell migration assay performed on SH-SY5Y cells after treating with exosomes (10 µg/mL) isolated from SK-N-BE2 and SH-SY5Y cells. There was a significant increase in the migratory ability of SH-SY5Y cells upon SK-N-BE2 cell-derived exosomes treatment (n = 3). (c) Wound healing assay was performed on SH-SY5Y cells (n = 3). The monolayer of cells closed the wound faster when the cells were treated with SK-N-BE2 cell-derived exosomes (10 µg/mL). Error bars represent the standard error of mean, * denotes p < 0.05 and ** denotes p < 0.01 as determined by student’s t-test.
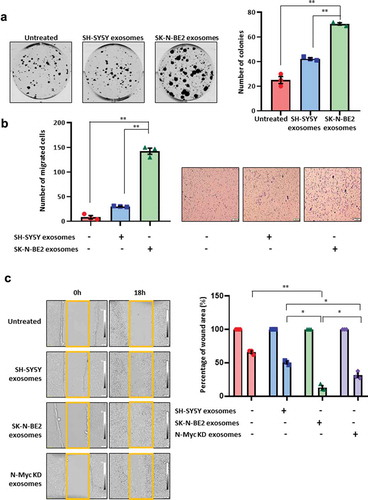
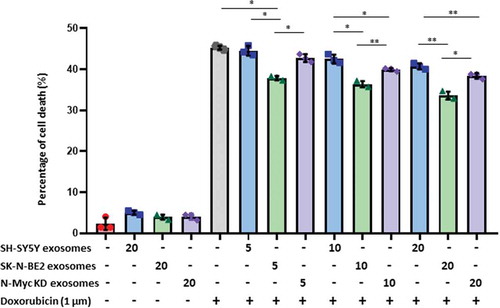
Figure 4. Exosomes derived from SK-N-BE2 cells conferred chemoresistance to SH-SY5Y cells.
FACS apoptosis assay was performed on SH-SY5Y cells after treatment with SK-N-BE2, SH-SY5Y and N-Myc KD cell-derived exosomes (5, 10 and 20 μg/mL), doxorubicin (1 µM) and combinational treatment of exosomes and doxorubicin. As shown in the graph, SH-SY-5Y cells obtained resistance to doxorubicin in the presence of SK-N-BE2 cell-derived exosomes (n = 3). Error bars represent the standard error of mean, * denotes p < 0.05, ** as determined by student’s t-test.