Figures & data
Figure 1. Uptake of cancer-derived EVs by stromal cells in mouse mammary tumours and lungs. (a) Schema of mouse tumour EV uptake analysis: mouse breast cancer 4TO7 cells expressing CD63-GFP and unlabelled 4TO7 cells were implanted in the MFPs of SCID mice. After 2 weeks, cells were dissociated from the tumours and the lungs and analysed by FACS. (b) Average percentage of GFP+ cells in each indicated cell population isolated from 4TO7-CD63-GFP tumours, unlabelled 4TO7 tumours and lungs (n = 4 mice). Bar graph represents mean ± SEM. **P < 0.01 determined by Student’s t-test. (c) Immunostaining of 4TO7-CD63-GFP tumours. Tumour cryo-sections were stained with DAPI and antibodies for CD45, CD31, CD140a, F4/80, Ly6G and EPCAM to mark leukocytes, endothelial cells, fibroblasts, macrophages, neutrophils and tumour cells, respectively. Arrows indicate colocalization of GFP and the cellular markers (also shown in the inserts). Scale bar, 10 µm.
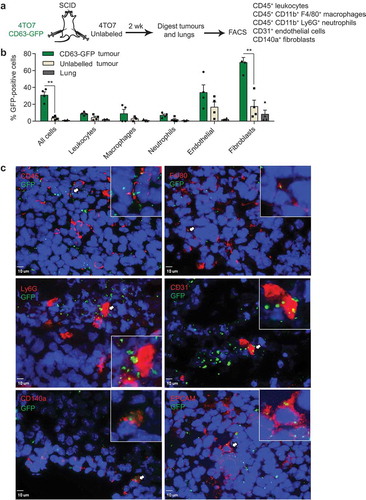
Figure 2. Uptake of cancer-derived EVs by stromal cells in human mammary tumours and lungs. (a) Schema of human tumour EV uptake analysis: implantation of human breast cancer MCF10CA1a (CA1a) cells expressing CD63-GFP or surface mCherry (SmCherry) and unlabelled CA1a cells in the MFPs of NSG mice. When tumours reached 15 mm in diameter (4 weeks), cells were dissociated from the tumours and analysed by FACS. (b) Average percentage of GFP+ cells in each indicated cell population isolated from CA1a-CD63-GFP tumours relative to unlabelled tumours of the same mice (n = 3 mice). (c) Average percentage of mCherry+ cells in each indicated cell population isolated from the CA1a-SmCherry tumours relative to the unlabelled tumours of the same mice (n = 3 mice). (d) Immunostaining of CA1a-SmCherry tumours. Tumour sections were stained with antibodies to αSMA (green) to mark cancer-associated fibroblasts (CAFs) and mCherry (red) fluorescence marked EVs from CA1a-SmCherry cells. Scale bar, 3 µm. (e) 3D view of CAFs showing colocalization of αSMA and mCherry (yellow). (f) Schema of human tumour EV uptake analysis in the lung: CA1a-CD63-GFP cells were injected in the tail vein of NSG mice. After 6 weeks, cells were dissociated from the lung and analysed by FACS. (g) Average percentage of GFP+ cells in each indicated population isolated from the lungs of mice injected with CA1a-CD63-GFP cells relative to those injected with unlabelled CA1a cells (n = 3 mice). All bar graphs represent mean ± SEM.
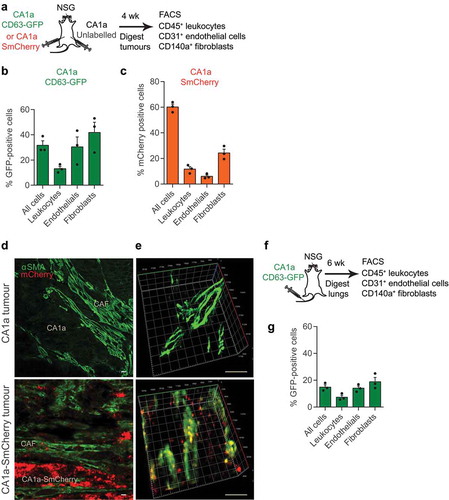
Figure 3. Identification of abundant miRNAs in EVs derived from breast cancer cells. (a) Schema for EV purification and RNA sequencing: conditioned media were collected from 4T1 cells and 4TO7 cells; dead cells and debris were removed using low speed centrifugation and filtration; EVs were pelleted and washed using ultracentrifugation; total RNA were extracted from EVs and cells; ribosomal RNAs were removed; small RNAs were converted to cDNA and sequenced using the Illumina HiSeq platform. (b) Number of miRNAs identified in 4T1 cells and 4T1 EVs. (c) Intracellular versus EV levels of each miRNA from 4T1 cells. (d) Number of miRNAs identified in 4TO7 EVs and 4T1 EVs. (e) 4T1 EV versus 4TO7 EV levels of each miRNA. Data were obtained using Illumina small RNA sequencing.
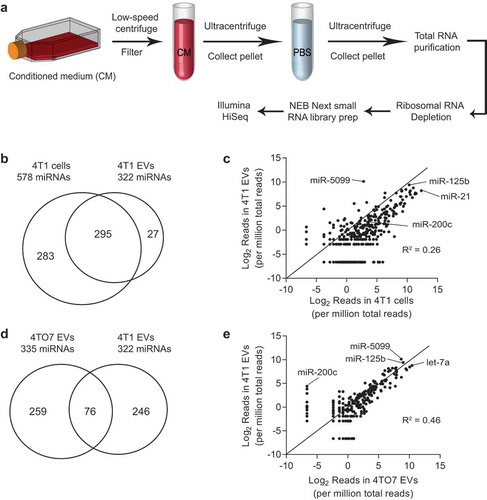
Figure 4. Purification of tumour EVs using density and size selection. (a) Schema for EV purification from conditioned medium (CM) using ultracentrifugation with a 60% sucrose cushion and size exclusion chromatography (SEC). (b) Concentrations of EVs (red) and proteins (black) in each SEC fraction, determined using nanoparticle tracking analysis and BCA assay, respectively. (c) Western blot analysis of EV markers (Alix, Tsg101) and beta-actin (Actb) in 4T1 cells, eluted proteins (SEC fraction 16 to 22), and eluted EVs (SEC fraction 7 to 11). (d) FACS analysis of CD63 on the surface of 4T1 EVs. EV fractions (SEC fraction 7–11) and protein fractions (SEC fraction 16–22) were incubated with CD63-antibody coated magnetic beads and detected with CD63-PE antibody. (e) Representative transmission electron microscopy images of 4T1 EVs before and after SEC. Scale bar: 200 nm. (f) Average concentrations (100× dilution) of 4T1 EVs from 3 batches ± SEM (grey) and their size distribution, determined using nanoparticle tracking analysis.
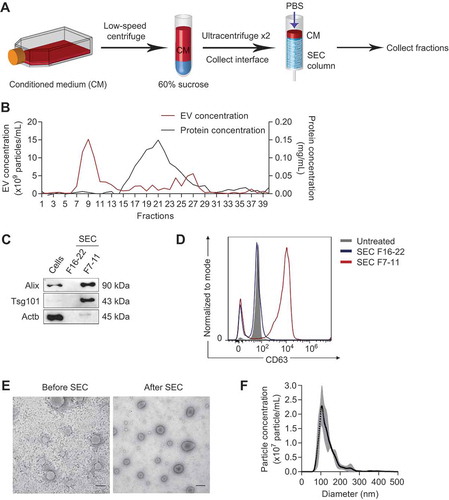
Figure 5. Tumour EVs contain functional miR-125b that are taken up by fibroblasts. (a) Average miR-125b levels in 4T1 EVs after treatments with RNase If and Triton X-100 for 30 min, relative to miR-125b levels in the control untreated group, normalized to spike-in control cel-miR-39a (n = 3 independent repeats). (b) Intensity of PKH26 fluorescence (top) and particle concentration (bottom) in fractions collected from sucrose-gradient-separation of 4T1 EVs that were labelled with PKH26 dye or a control solution in which PBS was mixed with PKH26 dye. Labelled EVs or the control solution were loaded onto a 5–60% sucrose gradients and separated by ultracentrifugation for 18 h. Fractions were collected from the top to bottom. (c) FACS analysis of PKH26 in mouse adult tissue fibroblasts (mATFs) that were incubated with fraction 10 to 12 (F10-12) of the sucrose-gradient-purified EVs or of the control sample (Cont). (d) qPCR analysis of miR-125b and pri-mir-125b levels in mATFs that were incubated with 4T1 EVs or PBS relative to snoRNA234 or Gapdh levels, respectively (n = 4 independent repeats). (e) qPCR analysis of CAF markers relative to Gapdh in mATFs that were incubated with 4T1 EVs or with PBS (n = 4 independent repeats). (f) Average luciferase activity in HEK-293T cells that were transfected with a reporter plasmid (containing 3 binding sites for miR-125b) and incubated with 108 to 1010 EVs from 4T1 cells for 24h (n = 3 independent replicates). All bar graphs represent mean ± SEM. ns – not significant, *P < 0/05, **P < 0.01, and ****P < 0.00001 determined by Student’s t-test.
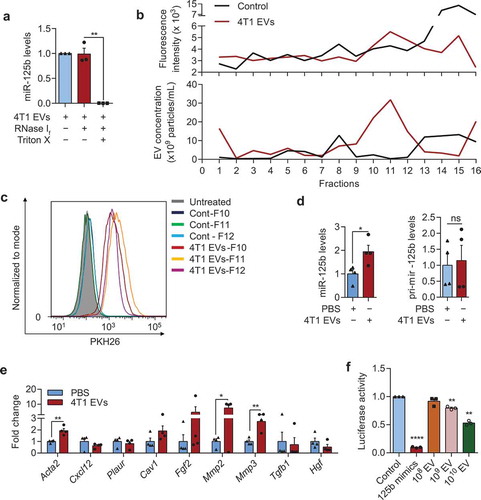
Figure 6. miR-125b-containing tumour EVs promote the activation of fibroblasts in the tumours. (a) Schema for 4TO7 tumour treatment: 250,000 4TO7 cells were coinjected with 2.25 × 10¹¹ (half-dose – 0.5D) or 4.5 × 10¹¹ (one dose – 1D) of 4T1 EVs or an equivalent volume of PBS (control) in the flanks of BALB/c mice. After 3 weeks, tumours were collected for FACS analysis of CD140a and immunohistochemical (IHC) staining of αSma. (b) Representative FACS analysis of CD140a vs. side scatter (SSC-A) in 4TO7 tumours treated as in (A). (C) Average percentage of CD140a+ cells in 4TO7 tumours (n = 3 mice) treated as in (A). (d) Representative IHC image of αSma (brown) in 4TO7 tumours treated as in (A). Tumour sections were also stained with haematoxylin (blue) for nuclear DNA. Scale bar: 50 µm. (e) Average normalized integrated optical density (IOD) of αSma signals (n = 3 mice) quantified using ImageJ. (f) Schema for miR-125b inhibition in 4T1 EVs: 4.5 × 10¹¹ 4T1 EVs were electroporated with anti-miR-125b ASO (125b-ASO) or scrambled negative control ASO (NC-ASO) and coinjected with 250,000 4TO7 cells in the flanks of female BALB/c mice. After 3 weeks, tumours were collected for FACS analysis of CD140a and IHC staining of αSma. (g) Average miR-125b levels in 4T1 EVs unelectroporated or electroporated with 125b-ASO or NC-ASO (n = 3 independent repeats). (h) Average miR-125b levels in mATFs incubated with 4T1 EVs unelectroporated or electroporated with 125b-ASO (n = 4 independent repeats). miR-125b levels were normalized to snoRNA234 levels. (i) Representative FACS analysis of CD140a in 4TO7 tumours treated as in (f). (j) Average percentage of CD140a positive cells in 4TO7 tumours (n = 3 mice) treated as in (f). (k) Representative IHC staining of αSma (brown) in 4TO7 tumours treated as in (f). Scale bar: 50 µm. (l) Average IOD of αSma signals (n = 3 mice). All bar graphs represent mean ± SEM. ns – not significant, * P < 0.05 determined by Student’s t-test.
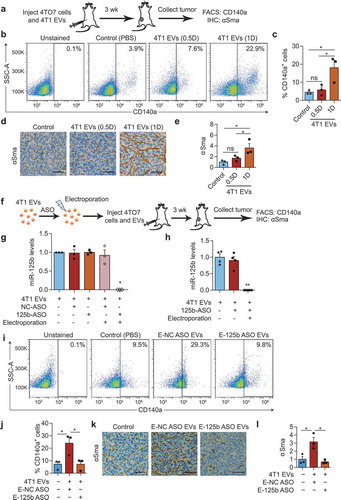
Figure 7. miR-125b-activated fibroblasts support tumour growth. (a) Schematic representation of fibroblast isolation from 4TO7-mCherry tumours, followed by miR-125b knockdown in fibroblasts and co-injection of transfected fibroblasts and 4TO7 cells in the MFPs of BALB/c mice. (b) qRT-PCR analysis of miR-125b in fibroblasts transfected with NC or 125b-ASO (n = 3 independent repeats). (c) Volume of 4TO7 tumours generated by coinjection of 4TO7 cells with fibroblasts treated as in (a) (n = 3 mice). (d) Representative FACS analysis of macrophages (CD45+CD11b+F4/80+), T lymphocytes (CD3+), neutrophils (CD45+CD11b+ Ly6G/C+), and dendritic cells (CD45+CD11c+) from 4TO7 tumours treated as in (a). (e) Average percentage of different immune cell types in 4TO7 tumours (n = 3 mice). (f) Representative haematoxylin and eosin (H&E) stained sections of the lungs from mice treated as in (a). Scale bar: 100 µm. White dotted circles indicate metastatic areas. (g) Average percentage of metastatic area in the lungs as shown in (f) (n = 3 mice). All graphs represent mean ± SEM. * P < 0.05, **P < 0.01, determined by Student’s t-test.
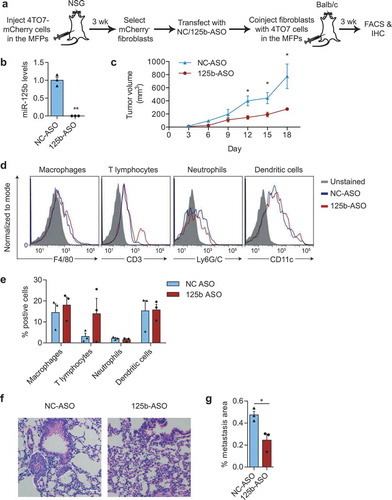
Figure 8. miR-125b activates mouse fibroblasts by targeting Tp53inp1. (a) Schema of miRNA mimics or siRNAs transfection in mouse adult tissue fibroblasts (mATFs). (b) qPCR analysis of miR-125b expression in mATFs transfected with NC or miR-125b mimics (n = 3 independent replicates). (c) qPCR analysis of cancer associated fibroblast (CAF) markers in transfected mATFs. (d) Representative immunostaining images of αSma (green) and nuclei (Hoechst, blue) in mATFs treated as in (b). Scale bar: 50 μm. (e) Average percentage of αSMA positive cells as in (d) (n = 5 independent images). (f) Western blot analysis of αSma and Gapdh in miRNA-transfected mATFs. Intensity of each band is indicated below the image. (g) Representative images of miRNA-transfected cells that invaded a matrigel transwell membrane, stained with crystal violet. (h) Average number of invaded cells per field (n = 3 independent replicates). (i) Average cellular impedance (wound-healing migration) of mATFs transfected with NC or miR-125b mimics, and quantified 24h after wounding using an electric cell-substrate impedance sensing (ECIS) chamber. (j) Average qPCR analysis of miR-125b targets in the p53 network in the miRNA-transfected mATFs. (k) qPCR analysis of Tp53inp1 in mATFs treated with EVs from 4T1 cells for 2 days (n = 4 independent replicates). (l) qPCR analysis of Tp53inp1 and CAF markers in mATFs transfected with Tp53inp1 or NC siRNA. (m) Western blot analysis of αSma and Gapdh in mATFs treated as in (l). All graphs represent mean ± SEM (n = 3 to 5 replicates). qPCR results represent fold change relative to NC treatment after normalization to an internal control, which is snoRNA234 (b) or Gapdh (c, j, k, and l). *P < 0.05, **P < 0.01, ***P < 0.001 and ****P < 0.0001 determined using Student’s t-test.
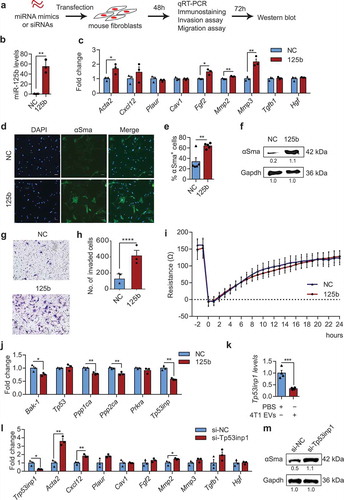
Figure 9. Secretion of miR-125b in EVs derived from human breast cancer cells and their uptake by fibroblasts. (a) Schema of MFP injection of human breast cancer cells in nude mice. After 12 weeks, blood samples were collected and circulating miRNA levels were analysed. (b) miRNA levels in the sera of tumour-free mice (n = 5) or mice with CA1a, BPLER or MB-231 tumours (n = 6) 12 weeks after implantation of the cells, relative to let-7i level, determined using Firefly circulating miRNA assay. (c) Average miR-125b levels in CA1a EVs after treatment with RNase If and Triton X-100 for 30 min, relative to miR-125b levels in the untreated group normalized to spike-in control cel-miR-39a (n = 3 replicates). (d) Schema of CA1a-SmCherry or CA1a cell implantation in the MFPs of NSG mice. After 4 weeks, tumours were collected and sorted for CD140a+ mCherry+ and CD140a+ mCherry− fibroblasts. (e) FACS separation of mCherry+ cells (gated) from the CD140+ population of CA1a-SmCherry tumours relative to unlabelled CA1a tumours. (f) qPCR analysis of miR-125b in sorted mCherry-negative and positive fibroblasts relative to snoRNA234 (n = 3 mice). (g) qPCR analysis of CAF markers in mCherry+ fibroblasts as compared to mCherry− fibroblasts (n = 3 mice). All bar graphs represent mean ± SEM. *P < 0.05, **P < 0.01, ***P < 0.001 and ****P < 0.0001 determined by Student’s t-test.
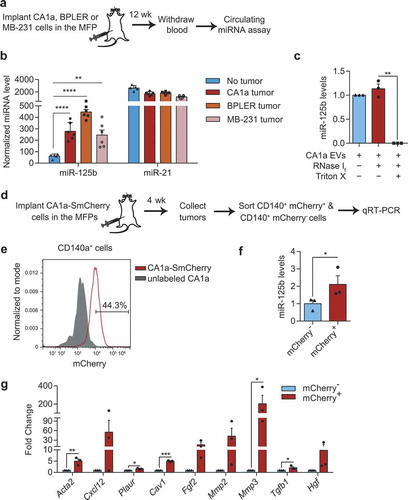
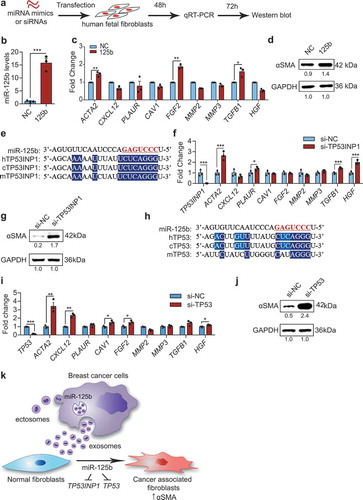
Figure 10. miR-125b activates human fibroblasts through suppression of TP53INP1 and TP53. (a) Schema of transfection of miRNA mimics or siRNAs in human foetal tissue fibroblasts (hFTFs). (b) qPCR analysis of miR-125b in hFTFs transfected with NC or miR-125b mimics. (c) qPCR analysis of CAF markers in the mimics transfected hFTFs. (d) Western blot analysis of αSMA relative to GAPDH in miRNA-transfected hFTFs. (e) miR-125b binding sites in TP53INP1 mRNA in humans (h), chimpanzees (c) and mice (m). (f) qPCR analysis of CAF markers in hFTFs transfected with NC or TP53INP1 siRNA. (g) Western blot analysis of αSMA relative to GAPDH in hFTFs transfected with TP53INP1 siRNA. (h) miR-125b binding sites in TP53 mRNA in humans (h), chimpanzees (c) and mice (m). In (e) and (h), miR-125b seed sequence is coloured in red. Conserved bases are highlighted in dark blue (3 species) and light blue (2 species). (i) qPCR analysis of CAF markers in hFTFs transfected with NC or TP53 siRNA. (j) Western blot analysis of αSMA and GAPDH in hFTFs transfected with TP53 siRNA. (k) A model of miR-125b transfer from breast cancer cells to fibroblasts for activation of cancer associated fibroblasts via blocking TP53INP1 and TP53 in humans. All bar graphs represent mean ± SEM (n = 3 independent repeats). *P < 0.05, **P < 0.01, ***P < 0.001 and ****P < 0.0001 determined by Student’s t-test.