
Figures & data
Figure 1. Extracellular Vesicles (EVs) collection and isolation strategies. (a) Leech CNS were dissected and mechanically dissociated. Microglia were separated from neurons by filtration and primary cultured. (b) Microglial cell and apoptotic bodies were removed from the conditioned medium by successive centrifugation steps. EVs were isolated from conditioned medium by differential ultracentrifugation (UC samples) or submitted to further density gradient ultracentrifugation step. (c) EVs were collected in different fractions after OptiprepTM density gradient separation (ODG fractions).
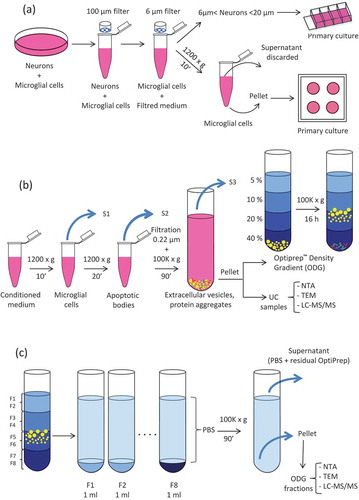
Figure 2. Nanoparticle Tracking Analysis (NTA) on microglial EVs. (a) Particles from UC samples (red dots) were quantified. Vehicle PBS (black triangles) was used as negative control. (b) Particles counting in ODG fractions F1 to F8 for each replicates (blue, red, and yellow dots) were compared to OptiprepTM gradient fractions processed in the same way as control (black triangles). Each circle or triangle represents an individual count. Green and grey bars indicate the average for EVs or control fractions, respectively.
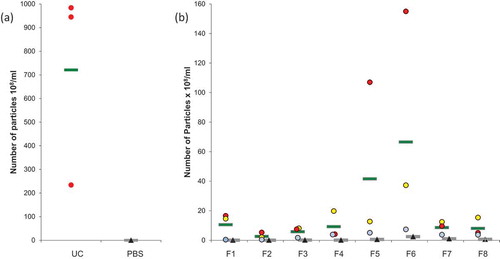
Figure 3. Transmission Electron Microscopy of EVs. (a) Morphology of OptiprepTM density gradient isolated EVs. Some vesicles are more electron-dense (arrow). (b) EVs purified by simple ultracentrifugation appear flattened. A layer of globular lipids was noticed in the background (arrow heads). (c) EVs aggregates were observed independently of the isolation protocols used.
Figure 4. Venn’s diagrams of unique and shared proteins identified in UC and ODG samples. (a) Comparison between UC, ODG EV-rich (F4, F5, F6) and ODG EV-poor (F1, F2, F3, F7, F8) fractions. (b) Number of proteins identified in ODG EV-rich fraction F4, F5 and F6. (c) Unique and shared proteins identified in ODG EV-poor fractions F1, F2, F3, F7 and F8. (d) Proteins overlap between fractions (F3, F7) physically close to the EV-rich ones (F4 and F6).
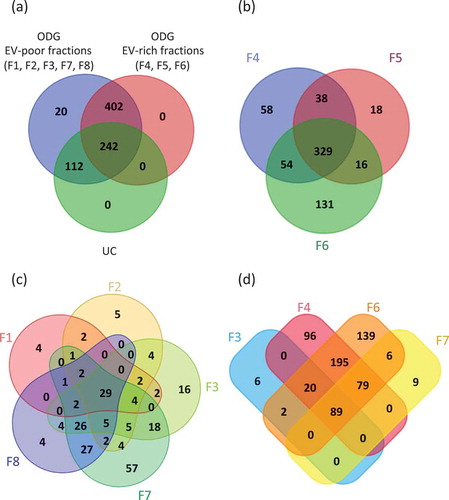
Table 1. EVs proteins recovered from UC samples and ODG fractions (F1 to F8) compared with top 100 proteins from ExoCarta website. Proteins were ranked according to their abundancy of identification in exocarta. Protein IDs and gene names are reported. In bold: proteins found at least one time in EVs issued from leech microglia. Underlined in red: proteins from ODG EV-rich fractions, which are reported in Exocarta as microglial proteins.
Figure 5. Gene Ontology (GO) analysis of EVs. Comparison between UC and ODG samples in term of number of genes identified for different GO terms.
Figure 6. In vitro assays for EVs neurotrophic activity assessment of ODG purified EVs. (a) Outgrowth measurements of leech neurons exposed for 14 days to complete medium (Control, n = 38) or to vesicles from ODG EV-rich fractions (n = 37). Each open circle represents the percentage of neurite outgrowth from individual neurons. Bars indicate the average values for each series of measurements. A significant difference was observed between the two conditions with a p-value of 0.0029. (b) and (c) pictures display an example of neurite outrgrowth recorded for the same neurone at 6 and 20 days of culture with L15 medium alone (Control) or containing 106 EVs/well (ODG EV-rich fractions). Scale bars correspond to 20 µm.
Table 2. Nerve cell metabolic pathways from the interactome map designed by FunRich software. Genes, names and IDs of proteins identified or not detected from EVs proteomic analyses are reported in black and red, respectively.