Figures & data
Table 1. Current and proposed criteria to define ApoBDs.
Figure 1. Monitoring the size distribution of ApoBDs. (a) Histogram plots of 4 μm, 6 μm, 10 μm and 15 μm polystyrene microspheres, monitored in forward scatter (FSC) by flow cytometry. (b) A5Intermediate/High apoptotic bodies (ApoBDs) and apoptotic cells generated from THP-1 and LIM1215 cells 4 h post-UV irradiation. Events were distributed into size ranges (μm) of <4, 4–6, 6–10, 10–15 and >15 based on bisector tool analysis of polystyrene microspheres in (a), using FlowJo software. Data are representative of two independent experiments. (c) Live differential inference contrast (DIC) microscopy image of a THP-1 cells undergo apoptotic cell disassembly. THP-1 cells were induced to undergo apoptosis by UV irradiation and generate ApoBDs predominately via the fragmentation of beaded apoptopodia. Scale bar, 5 or 10 μm as indicated. Data are representative of at least three independent experiments.
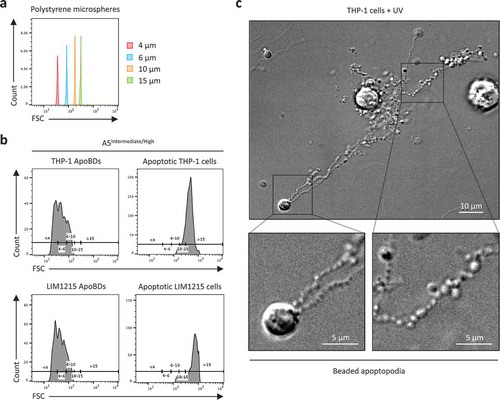
Figure 2. Phosphatidylserine exposure on ApoBDs is a spectrum. A5-FITC staining of phosphatidylserine (PtdSer) on ApoBDs generated from THP-1 (a) and LIM1215 (b) cells, as determined by confocal microscopy. A selection A5Intermediate and A5Low ApoBDs are shown. Selected ApoBDs are displayed as z-stack images to show the distribution of A5-FITC staining on ApoBDs. Scale bar, 5 μm. Data are representative of at least three independent experiments.
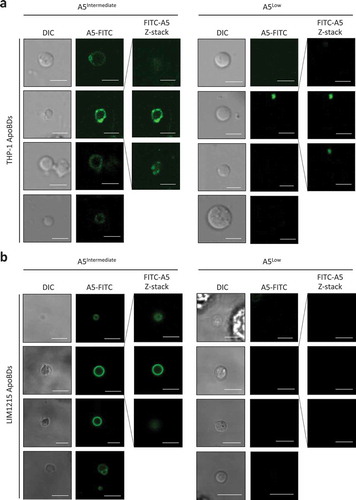
Figure 3. Monitoring caspase-cleaved substrates in purified ApoBDs. (a) Schematic of caspase 3/7 targeting substrates at the plasma membrane, cytoplasm and nucleus. (b) Flow cytometry analysis of the relative levels of viable cells, apoptotic cells, ApoBDs and necrotic cells in untreated, UV-treated, ApoBD depleted and ApoBD enriched samples (n = 3). THP-1 monocytes were used as a model cell line. The presence of (c) PANX1 and caspase-cleaved PANX1, PARP1 and caspase-cleaved PARP1, (d) ROCK1 and caspase-cleaved ROCK1 in untreated and apoptotic samples was determined by immunoblotting. Data are representative of at least two independent experiments.
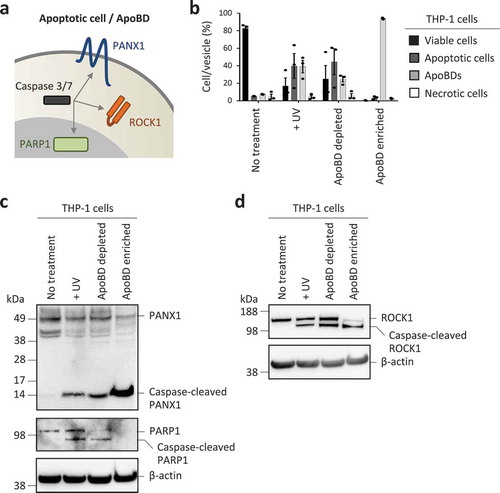
Figure 4. ApoBDs undergo lysis over time. (a) Schematic of the release of intracellular proteins such as lactate dehydrogenase (LDH) and fluorescent proteins GFP and mCherry from ApoBD undergoing membrane lysis. (b) Flow cytometry analysis of ApoBD enriched samples, enriched by differential centrifugation, to determine ApoBD purity (n = 3). (c) ApoBD enriched samples were incubated for 0–6 h, and the level of ApoBD lysis determined by LDH release (n = 3). (d) Time-lapse images monitoring A5+ ApoBDs generated from PANX1−/− GFP+ mCherry+ Jurkat T cells. Scale bar, 5 μm. Data are representative of at least three independent experiments. (e) Loss of mCherry intensity in individual ApoBDs was quantified from microscopy images using the Zeiss Zen Lite 2.3 software and normalized to first sign of ApoBD lysis (n = 15). Units shown are arbitrary and Δ change in mCherry signal was determined by subtracting the mCherry signal at −150 min from the mCherry signal from all time points. (f) Monitoring ApoBD lysis by flow cytometry based on the loss of GFP signal in ApoBDs. Left, flow cytometry plots of electronic gating strategy used for analysing ApoBD lysis. Right, flow cytometry analysis of ApoBD lysis in UV-treated PANX1−/− GFP+ mCherry+ Jurkat T cells. Cells were incubated for 4 to 24 h post UV treatment (n = 3). Error bars represent s.e.m.
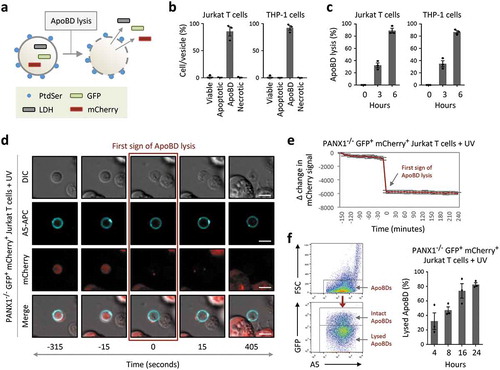
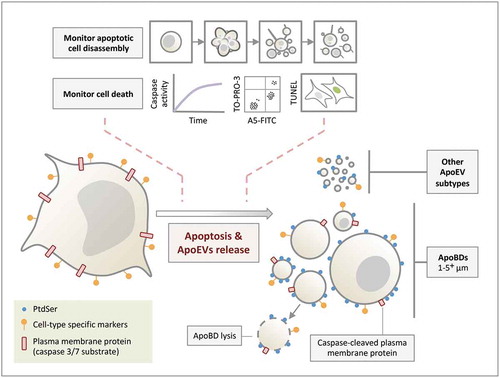
Figure 5. Formation of ApoEVs during apoptosis. ApoBDs and other ApoEV subtypes are generated during apoptosis. Although PtdSer and cell-type specific markers can be found on ApoEVs, these ApoEVs display less PtdSer and cell-type specific marker compared to apoptotic cells. Caspase-cleaved plasma membrane proteins (and cytoplasmic proteins, not depicted in the schematic) can be found in ApoBDs. ApoBDs will undergo membrane lysis (i.e. become secondary necrotic) over time under in vitro conditions. The progression of cell death and/or apoptotic cell disassembly should be monitored in ApoEV studies.