Figures & data
Table 1. Test parameters of the study subjects.
Table 2. Lipoproteins and blood cell counts in exercising humans.
Figure 1. Exercise setting and study design. (a) Exemplary illustration of the incremental cycling test and time points of sample collection. Diagram depicts blood lactate (black line) and cell-free DNA levels (cfDNA; grey line), measured every 3 min at each increment. Lactate and cfDNA strongly increase after the individual anaerobic threshold (IAT, dashed vertical line) until exhaustion of the subject. Venous blood was drawn before starting the test (pre), during the test at the respiratory quotient (RQ) 0.9 and immediately at the end of exercise (post). (b) Outline of the combined experimental strategy to characterize EVs released during exercise (ExerVs). Blood cell counts and metabolic parameters were assessed in venous blood samples taken at the three time points indicated in (a). EV Array and cfDNA analysis were performed with unprocessed plasma. For WB and MACSPlex analysis, EVs were purified from plasma by SEC or immuno-bead isolation using CD9-, CD63- or CD81-magnetic beads.
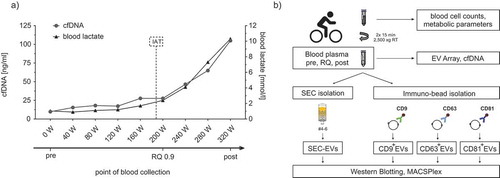
Figure 2. EV Array analysis of plasma EVs from exercising humans. (a) Heatmap of EV Array markers that change in relative intensity during exercise. Markers depicted were higher than the LOD in more than 50% of cases. (b) Fold changes of significantly increasing markers depicted with 95%-confidence intervals (CI). Bonferroni-corrected students t-test, * = p < 0.05, ** = p < 0.01, *** = p < 0.001, n = 10.
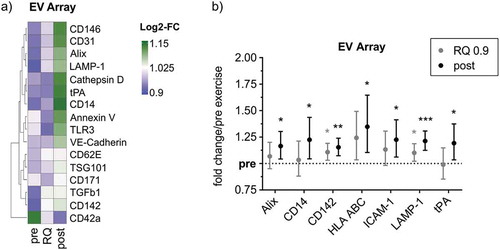
Figure 3. SEC-isolation of EVs. (a,b) NTA (bars) and protein content (line) of SEC fractions as well as WB analysis of SEC fractions using genuine EV-markers (CD9, CD63, CD81), a platelet-specific marker (CD41b) and Apolipoprotein A1 (ApoA1) as lipoprotein marker. Fractions 4 to 6 (= SEC-EVs) are considered EV-rich while plasma protein- and lipoprotein-poor. (c) Transmission electron microscopy image of SEC-EVs. Scale bar refers to 200 nm. (d) Representative NTA size distribution profile of SEC-EVs collected pre, at RQ 0.9 and post-exercise. (e) NTA total particle counts in SEC-EVs collected pre, at RQ 0.9 and post-exercise (SEM, n = 7).
Figure 4. Quantitative analysis of SEC-isolated ExerVs. (a) Representative WB analysis of SEC-EVs (pooled fractions 4–6) using EV-markers, muscle marker alpha-sarcoglycan (SGCA) and lipoprotein marker ApoA1. (b) Densitometric quantification of WB signals. Individual (circle) and mean (bar) fold changes of WB markers. RQ 0.9 and post expressed in relation to pre-exercise (dashed line). Bonferroni-corrected students t-test, n = 7–11, *** = p < 0.001. (c, d) WB analysis and NTA of SEC-EVs of one study subject after fasting and a high-fat meal. Number of particles increase by an order of magnitude while WB signals diminish upon high-fat diet.
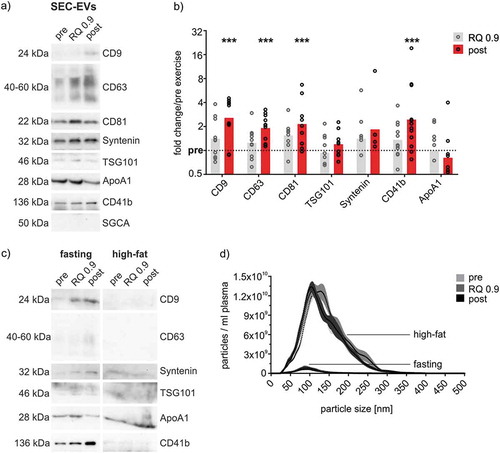
Figure 5. Phenotyping of SEC-isolated ExerVs by MACSPlex analysis. (a) Principle of the MACSPlex assay: Isolated EVs are captured by colour-coded beads carrying specific antibodies for cell surface markers. Subsequently, detection antibodies for the EV-markers CD9, CD63 and CD81 conjugated to APC bind to the EVs. Read-out is achieved by flow cytometry revealing the surface marker profile of EV-samples. (b) Mean fluorescence intensities (MFI) displayed in MACSPlex analysis of SEC-EVs isolated from plasma of one representative exercising subject. (c) Heatmap visualization of individual MACSPlex marker increases in SEC-EVs including hierarchical clustering for markers as well as subjects. Log2-fold changes of MFI at RQ 0.9 and post in relation to pre-exercise are presented. (d, e) Mean tetraspanin and selected cell surface marker elevations with 95%-CI during exercise. Bonferroni-corrected students t-test, * = p < 0.05, ** = p < 0.01, *** = p < 0.001, n = 8.
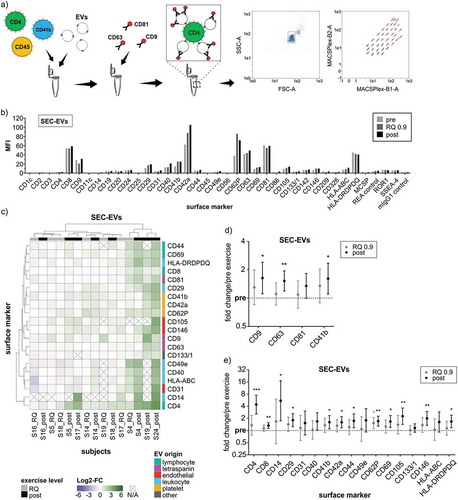
Figure 6. Quantitative WB analysis of immunobead-isolated ExerVs. (a) Representative WB analysis of CD9+EVs, CD63+EVs and CD81+EVs using EV-markers and lipoprotein marker ApoA1. (b-d) Densitometric quantification of WB signals. Individual (circle) and mean (bar) fold changes of WB markers in (b) CD9+EVs, (c) CD63+EVs and (d) CD81+EVs. RQ 0.9 and post expressed in relation to pre-exercise (dashed line). Bonferroni-corrected students t-test, n = 2–7, * = p < 0.05, ** = p < 0.01, *** = p < 0.001.
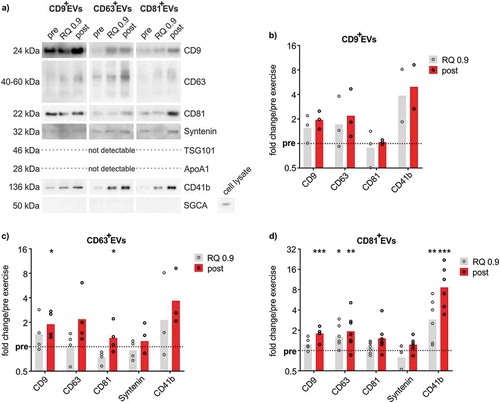
Figure 7. MACSPlex phenotyping of CD9+-, CD63+- and CD81+ExerVs. (a) Representative mean fluorescence intensities (MFI) of markers determined in MACSPlex analysis of immunobead-isolated CD9+EVs, CD63+EVs and CD81+EVs. (b) Heatmap visualization of individual surface marker increases in immunobead-isolated ExerVs including hierarchical clustering for markers as well as subjects. Log2-fold changes of MFI at the RQ 0.9 level and post-exercise in relation to pre-exercise are presented.
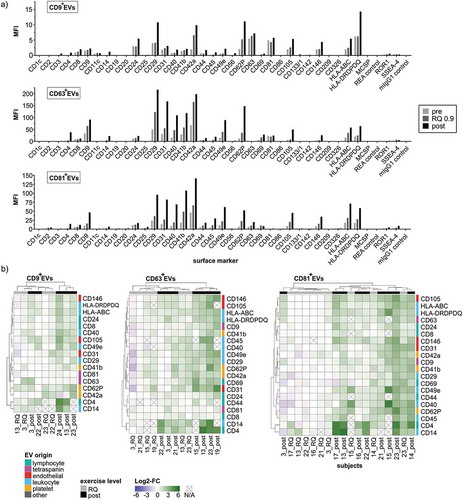
Figure 8. MACSPlex marker kinetics of CD9+-, CD63+- and CD81+ExerVs. (a-d) Mean cell surface marker elevations with 95%-CI at RQ 0.9 and post-normalized to pre-exercise in (a) CD9+EVs (n = 5), (b) CD63+EVs (n = 7) and (c) CD81+EVs (n = 9). Individual values of biological replicates in . Bonferroni-corrected students t-test, * = p < 0.05, ** = p < 0.01, *** = p < 0.001.
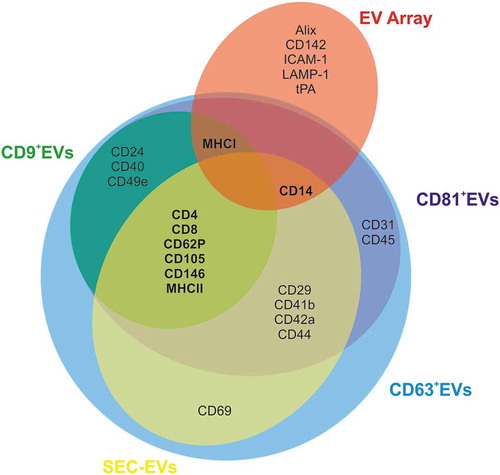
Figure 9. Venn diagram summarizing ExerV-phenotyping. Circles depict unique and shared ExerV-markers that were significantly increased in the different isolation and characterization strategies (EV Array versus SEC-EVs versus bead-isolated EVs). Unique markers are only associated with EV Array performed on total plasma, while the different EV-isolation strategies, including bead-isolated EV-populations, largely share the same markers.