
Figures & data
Figure 1. DPPIV is expressed in normal placentae, MEDIUM/LARGE STB-EVs and SMALL STB-EVs.
Transmission electronic microscopy of MEDIUM/LARGE STB-EVs (scale bar represents 1000 nm) (a) and SMALL STB-EVs (b) (scale bars represent 200 nm) isolated from normal placentae. (c) Representative Nanoparticle Tracking Analyses (NTA) size vs. distribution profiles of MEDIUM/LARGE STB-EVs and SMALL STB-EVs from normal pregnancies. (d) Representative Western blot (n = 3) of DPPIV protein expression in whole placental lysates, MEDIUM/LARGE STB-EVs and SMALL STB-EVs isolated from control term placentae. Recombinant human DPPIV protein (Rec. DPPIV) was used as positive control. PLAP expression confirmed syncytiotrophoblast origin; expression of exosomal marker syntenin was enriched in SMALL STB-EVs. Blots are representative of n = 3 separate experiments. (e) Control placental sections were subjected to immunohistochemical analysis for DPPIV expression (left panel). DPPIV positivity is seen at the syncytiotrophoblast (arrow). As negative controls, placental sections were incubated with anti-IgG1 antibody (right panel). Images are representative of n = 3 separate experiments. Scale bar sets at 200 µm.
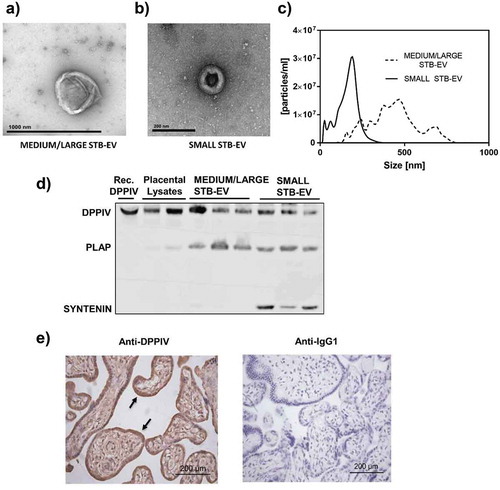
Table 1. DPPIV is co-expressed with PLAP on MEDIUM/LARGE STB-EVs.
Figure 2. DPPIV and PLAP co-expression in MEDIUM/LARGE STB-EVs.
Representative image of flow cytometry analysis of MEDIUM/LARGE STB-EV (n = 3) derived from dual placental lobe perfusion showing (a) forward scatter (FSC) versus side scatter (SSC) dot plot of MEDIUM/LARGE STB-EVs. Fluorescent microspheres of 1 μm (Polysciences Inc., Warrington, PA, USA) were used to establish a gate <1 μm. Events that fell into this gate were subject to further analysis. (b) Bio-maleimide (BioM) fluorochrome minus one (FMO) was used to draw 1% cut-off gate for BioM-positive events. (c) PLAP FMO was used to draw 1% cut-off gate for PLAP-positive events. (d) DPPIV FMO was used to draw 1% cut-off gate for DPPIV-positive events. (e) The co-expression of PLAP-PE and DPPIV-Alexa Fluor 647 on MEDIUM/LARGE STB-EVs (Quadrant 2). (f) Representative Nanoparticle Tracking Analysis (NTA) size distribution profile of total MEDIUM/LARGE STB-EVs, MEDIUM/LARGE STB-EVs population depleted of MEDIUM/LARGE STB-EVs expressing DPPIV and MEDIUM/LARGE STB-EVs expressing PLAP. (g) Percentage of particle number after PLAP or DPPIV depletion. (h) Representative NTA size distribution profile of total MEDIUM/LARGE STB-EVs, MEDIUM/LARGE STB-EVs population depleted of MEDIUM/LARGE STB-EVs expressing IgG2a and MEDIUM/LARGE STB-EVs population depleted of MEDIUM/LARGE STB-EVs expressing IgG1. Graphs are representative of n = 3 experiments. (i) DPPIV and PLAP protein expression in total MEDIUM/LARGE STB-EVs (Total), in MEDIUM/LARGE STB-EVs population pulled out with anti-DPPIV magnetic beads (DPPIV PO), in MEDIUM/LARGE STB-EVs population pulled out with anti-PLAP magnetic beads (PLAP PO), in MEDIUM/LARGE STB-EVs population pulled out with anti-IgG2a magnetic beads (IgG2a PO) and in MEDIUM/LARGE STB-EVs population pulled out with anti-IgG1 magnetic beads (IgG1 PO). Blot is representative of n = 3 experiments.
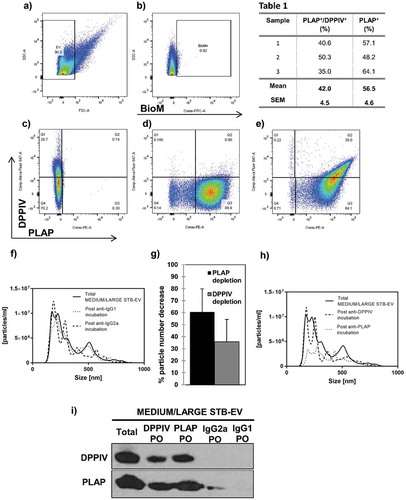
Figure 3. DPPIV and PLAP co-expression in SMALL STB-EVs.
(a) Representative Nanoparticle Tracking Analysis (NTA) size distribution profile of total SMALL STB-EVs, SMALL STB-EVs population depleted of SMALL STB-EVs expressing DPPIV and SMALL STB-EVs expressing PLAP. (b) Percentage of particle number after PLAP or DPPIV depletion. (c) NTA size distribution profile of total SMALL STB-EVs, SMALL STB-EVs population depleted of SMALL STB-EVs expressing IgG2a and SMALL STB-EVs population depleted of SMALL STB-EVs expressing IgG1. Graphs are representative of n = 3 experiments. (d) DPPIV and PLAP protein expression in total SMALL STB-EVs (Total), in SMALL STB-EVs population pulled out with anti-DPPIV magnetic beads (DPPIV PO), in SMALL STB-EVs population pulled out with anti-PLAP (PLAP PO), in SMALL STB-EVs population pulled out with anti-IgG2a magnetic beads (IgG2a PO) and in SMALL STB-EVs population pulled out with anti-IgG1 magnetic beads (IgG1 PO). Blot is representative of n = 3 experiments.
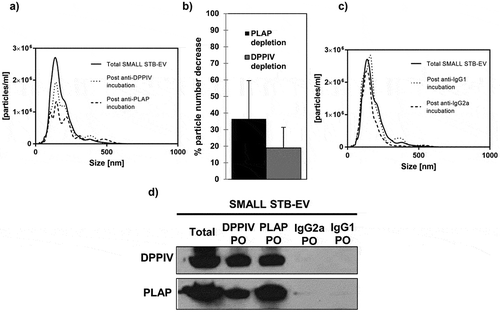
Figure 4. DPPIV in MEDIUM/LARGE STB-EVs and SMALL STB-EVs is enzymatically functional.
(a) MEDIUM/LARGE STB-EVs and (b) SMALL STB-EVs from control women were incubated with 0, 1, 10 or 100 nM vildagliptin (inhibitor of DPPIV) and DPPIV activity was measured. Percentage of residual DPPIV activity was calculated in (a) MEDIUM/LARGE STB-EVs and (b) SMALL STB-EVs. Graphs are representative of n = 3 experiments performed independently in duplicates (*p < 0.05). (c) MEDIUM/LARGE STB-EVs and(d) SMALL STB-EVs pools from three GDM women were diluted to 7, 1.4 or 0.07 mg/ml and incubated with 1400 pg/ml of standard GLP-1. Graphs show levels of active GLP-1 measured after the incubation with MEDIUM/LARGE STB-EVs or SMALL STB-EVs. Recombinant DPPIV was used as positive control. Graphs are representative of n = 3 experiments performed independently in duplicates (*p < 0.05).
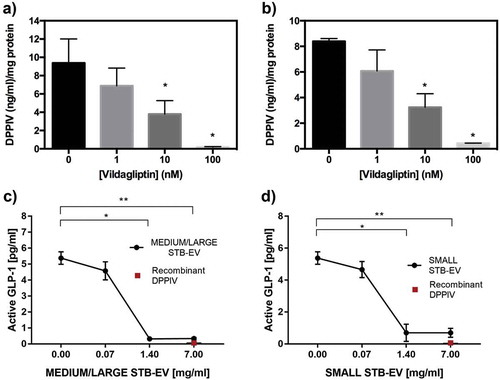
Figure 5. DPPIV expressing STB-EVs are present in the circulation and are placentally derived.
Paired plasma samples were collected from the uterine and the peripheral vein of pregnant women. (a) Individual PLAP-positive event numbers from matched peripheral and uterine vein plasma samples (n = 5 women; *p < 0.05). (b) Individual PLAP/DPPIV double-positive event numbers from matched peripheral and uterine vein plasma samples (n = 5 women; *p < 0.05).
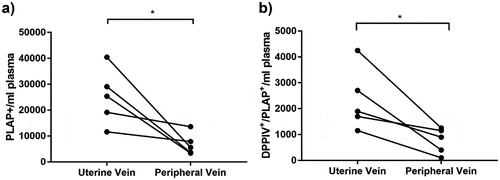
Figure 6. DPPIV activity is increased in STB-EVs of GDM pregnancies.
(a) DPPIV concentration in MEDIUM/LARGE STB-EVs from GDM versus control isolated from placental perfusions (n = 6 for both groups; *p < 0.05). (b) DPPIV concentration in SMALL STB-EVs from GDM versus control isolated from placental perfusions (n = 6 for both groups; *p < 0.05).
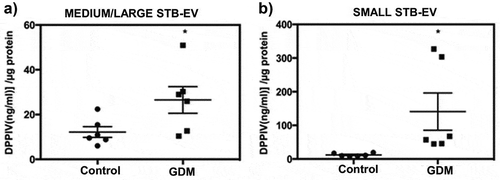
Figure 7. Placenta-derived DPPIV expression is increased in GDM peripheral plasma.
Peripheral gestation-matched plasma samples were collected from GDM (n = 8) and Control (n = 8) pregnant women. DPPIV and PLAP double-positive events in 1 ml of plasma were identified by flow cytometry. *P < 0.0157.
