Figures & data
Figure 1. Schematic representation of the four methodologies applied for extracellular vesicles (EVs) isolation and further EV profiling and glycosylation characterization. EVs were isolated by ultracentrifugation (UC), total exosome isolation (TEI), OptiPrepTM density gradient (ODG) and size exclusion chromatography (SEC) methodologies. ODG and SEC were applied after UC washing step (EVs*). TEI solution was applied directly to the conditioned medium (without previous UC).
Figure 2. Representative example of the 12 fractions obtained by OptiPrepTM density gradient. Fractions were weight scaled for density evaluation and syntenin-1 expression was assessed. Fractions 6 and 7 showed a density of approximately 1.1 g/mL and the highest expression of syntenin-1 extracellular vesicle marker.
Figure 3. Effects of FBS depletion in morphology and viability of MKN45 and glycoengineered MKN45 human gastric cancer cell lines. (a) Schematic depiction of STn biosynthesis. Increased expression of ST6GalNAc1 enzyme or mutations on COSMC gene preclude elongation of the O-glycosylation. (b) Cells grown in the absence (-FBS) or presence (+FBS) of FBS in the culture medium were fixated and stained with STn (green) and actin (red) antibodies and L-PHA (green) lectin. Nuclei were stained with DAPI (blue). Images were taken with a confocal microscope. Scale bar represents 10 µm. Brightfield pictures acquired in an inverted microscope show the differences in cell morphology. Scale bar represents 50 µm. (c) Comparison of viable cells in proliferation when subjected to culture medium supplemented with different percentages of FBS for 48 h. Boxplot represents the values corresponding to the absorbance at 490 nm corrected by the blank. Two independent experiments with triplicates were conducted. As positive control, 1 mM H2O2 was added to the cells. Statistical analysis was calculated with Kruskal-Wallis test: MKN45 p = 0.212 and gMKN45 p = 0.244; p-value > 0.05 was considered non-significant. Abbreviations: FBS: fetal bovine serum; L-PHA: Phaseolus vulgaris leucoagglutinin; STn: sialyl-Tn.
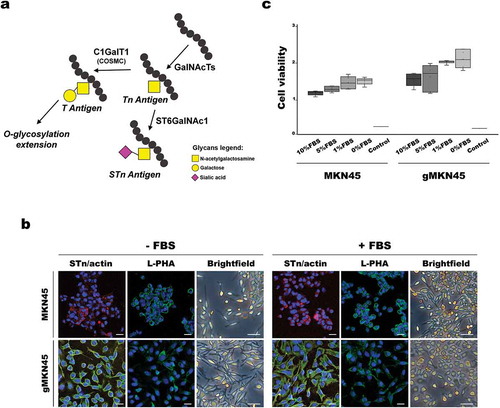
Figure 4. Characterization of extracellular vesicles isolated by differential ultracentrifugation (UC), total exosome isolation (TEI), OptiPrepTM density gradient (ODG) and size exclusion chromatography (SEC) methodologies using NTA analysis and transmission electron microscopy (TEM) imaging, including lower magnification (left) and zoomed in pictures (right). Extracellular vesicles were collected from MKN45 and glycoengineered MKN45 (gMKN45) cell lines cultured in the absence (-FBS) or presence (+FBS) of FBS in the cell culture medium. At least two independent experiments were conducted. NTA graphs display in y-axis: concentration (in 106 particles/mL) and in x-axis: size (nm). TEM images: Scale bar represents 400 nm (left TEM panel) and 100nm (right TEM panel), respectively.
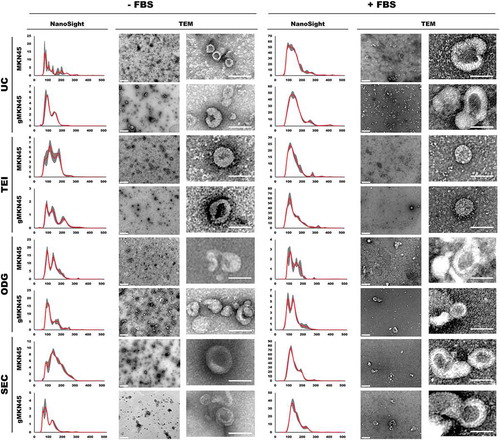
Figure 5. Identification by MS of representative proteins from lysates of extracellular vesicles. Silver staining of extracellular vesicle lysates obtained by different isolation methodologies from MKN45 (M) human gastric cancer cell line and glycoengineered MKN45 (gM) cultured 48 h with 1640 RPMI (-FBS) or with 1640 RPMI supplemented with 10% FBS (+FBS). The total cell lysates are also shown. *These bands were identified with a high number of candidate peptides without reaching statistical significance.
Figure 6. Protein profile of extracellular vesicles (EVs) isolated by differential ultracentrifugation (UC), total exosome isolation (TEI), OptiPrepTM density gradient (ODG) and size exclusion chromatography (SEC) from MKN45 (M) human gastric cancer cell line and glycoengineered MKN45 (gM) cells. (a) Western blotting of HSP70, syntenin-1, CD9, CD63, Alix and CD81 extracellular vesicle markers and cytochrome C mitochondria marker performed on total cell lysates and EV lysates in non-FBS supplemented medium or (b) cells cultured with medium supplemented with 10% FBS. At least two independent experiments were conducted. (c) Western blotting of syntenin-1, CD9 and CD63 EV markers on total cell lysates and EV lysates in non-FBS supplemented medium. EV samples were isolated by UC or ODG followed by TEI.
Figure 7. Glycan detection of extracellular vesicles obtained by differential ultracentrifugation (UC), total exosome isolation (TEI), OptiPrepTM density gradient (ODG) and size exclusion chromatography (SEC) in the absence (-FBS) or presence (+FBS) of FBS in the culture medium. Western blotting of total cell lysates and extracellular vesicle lysates secreted by MKN45 (M) human gastric cancer cell line and glycoengineered MKN45 (gM) using (a) an anti-STn antibody (red dots indicate high molecular weight glycoproteins displaying STn) and the different lectins (b) E-PHA, (c) L-PHA and (d) AAL. Glycan epitopes recognized by the lectins and the antibody used are depicted (left panel). At least two independent experiments were conducted. The right panel shows the control condition performed with total cell lysates and the pellet obtained after UC of medium supplemented with 10% FBS and without cell contact. Abbreviations: STn: sialyl-Tn; AAL: Aleuria aurantia lectin; E-PHA: Phaseolus vulgaris erythroagglutinin; L-PHA: Phaseolus vulgaris leucoagglutinin.
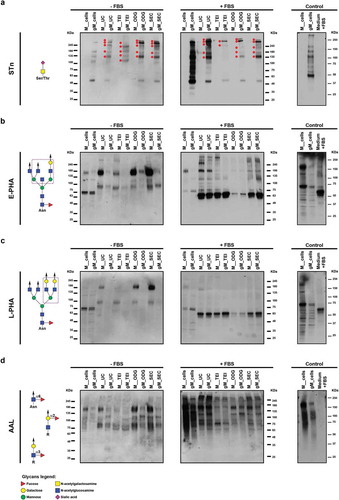
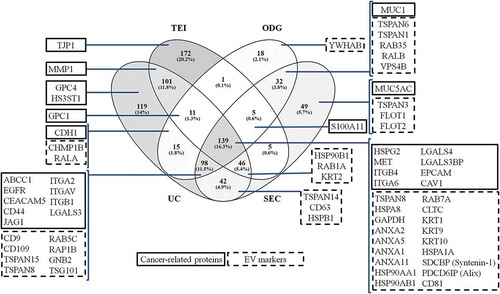
Figure 8. Representation of the proteins identified from extracellular vesicles (EVs) isolated by differential ultracentrifugation (UC), total exosome isolation (TEI), OptiPrepTM density gradient (ODG) and size exclusion chromatography (SEC) methodologies from glycoengineered MKN45 cells grown in the absence of FBS. Venn diagram demonstrates the number (and percentage) of unique and overlapping proteins identified by proteomic analysis for each EV isolation methodology. One experiment was conducted. Boxes highlight key cancer-related proteins (framed in full line) or EV markers (framed in dotted line) identified in the EV samples.