Figures & data
Figure 1. MiR-9 induces angiogenesis.
(a). HUVECs overexpressing miR-9 after transfection with LV3-miR-9 (miR-9) and LV3-NC (NC). Mean ± standard deviation (SD), n = 4. ***P < 0.001. Student’s t-test was performed. (b). Investigation of angiogenesis by confocal microscopy in the mouse ventral subcutaneous region following transfer of a murine Matrigel plug mixed with lentivirus-infected HUVECs (GFP, green), CD34 (red), and nuclei (DAPI, blue) in cryosections. Vessel (yellow arrowhead), vascular content (blue arrow). The vascular structures were circled by the white dotted line. (c–f). Evaluation of vessel density (c) and diameter (d) and immunohistochemistry (IHC) for CD31 (e) and CD34 (f). Both human CD31 (hCD31) and murine CD31 (mCD31) were stained (e). The vessel density (c) and diameter (d) were calculated using CD34 images (f). Mean ± standard error of mean (SEM). The density was the number of vessels per unit area (c), averaged over four view fields (larger views in Supplementary Figure 1) per murine Matrigel plug, four animals per group, n = 4. Student’s t-test was performed for vessel density. Frequency distribution curve of diameter (interval 10 and range 0–100) was performed by ImageJ. Chi-squared test was performed for vessels distribution. *** P < 0.001 vs. NC. The green line enclosed area is the vessel lumen (f). Diameter (Φ) = (lumen area/π)(1/2)×2. Small endothelial sprouts without apparent lumen were not calculated. At the upper left corner of (f), the enlarged views of the vessels are shown with the diameters for those indicated by the rectangular boxes. (g–i). IHC for TUNEL assay (g), p-Flk1 (h), and LC3B (i) in the mouse ventral subcutaneous region following transfer of a murine Matrigel plug mixed with lentivirus-infected HUVECs. Results shown are representatives of four experiments. (j–l). Quantitative reverse transcription polymerase chain reaction (j and k) and immunoblot results (l, 30 μg proteins) for VEGF and Flk1 in HUVECs overexpressing miR-9. Densitometric quantification (K, right). Mean ± SEM, n = 4. *P < 0.05; **P < 0.01; ***P < 0.001. Student’s t-test was performed.
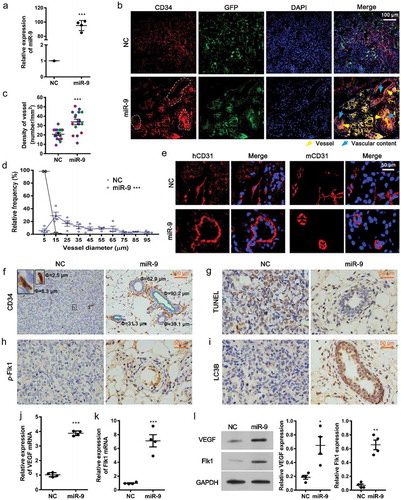
Figure 2. Vandetanib promotes miR-9-induced autophagy.
(a-c). Transmission electron microscopic views of AVi (yellow arrowhead), AVd (purple arrowhead) and MVB (brown arrowhead) in HUVECs overexpressing miR-9 and treated with vandetanib (a), and the number of AVis, AVds, and AVs (= AVis + AVds) in a single cell (b). Mean ± SEM, n = 4. *P < 0.05 vs. NC; #P < 0.05. Mean area of autophagic vacuoles (AVs) (c). Mean ± SEM, n = 4. *P < 0.05, ***P < 0.001. At the upper left corner of each image, there is a 2-fold enlarged view of the MVB indicated by the rectangular box. (d-f). Confocal microscopic views of LC3B (d), relative mean fluorescence intensity (rMFI) to that of NC (e), and the number of LC3 puncta per cell (f). Mean ± SEM, n = 4. *P < 0.05, **P < 0.01, ***P < 0.001 vs. NC; #P < 0.05, ##P < 0.01, ###P < 0.001. (g). Acridine orange (AO) staining of autophagosomes in HUVECs overexpressing miR-9 and treated with 3-MA or/and vandetanib. (h, i). Immunoblot for LC3B, Beclin-1 and p62 in HUVECs overexpressing miR-9 and treated with 3-MA or/and vandetanib (h, 20 μg proteins). Densitometric quantification (i). Mean ± SEM, n = 4. *P < 0.05; #P < 0.05.
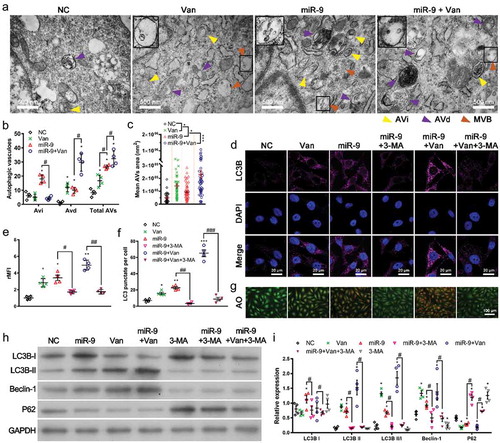
Figure 3. Autophagy acts as an adjuvant to Flk1-dependent angiogenesis.
(a). Concentration-dependent inhibition of p-Flk1 levels by vandetanib on HUVECs overexpressing miR-9. Immunoblot for p-Flk1 (top). Densitometric quantification (bottom). Mean ± SEM, n = 4. *P < 0.05, **P < 0.01 vs. HUVECs; #P < 0.05, ##P < 0.01 vs. miR-9. (b, c). Confocal microscopic view of p-Flk1 in HUVECs overexpressing miR-9 in the presence or absence of vandetanib and/or 3-MA treatment (b). Relative mean fluorescence intensity (rMFI) to that of NC (c). Mean ± SEM, n = 4. *P < 0.05; **P < 0.01 vs. NC. ##P < 0.01 vs. miR-9. (d, e). VEGF mRNA (d) and enzyme-linked immunosorbent assay of VEGF secretion in the culture supernatant (e) by HUVECs overexpressing miR-9 in response to vandetanib and/or 3-MA treatment. Mean ± SEM, n = 4. *P < 0.05, **P < 0.01, and ***P < 0.001 vs. NC; #P < 0.05, ##P < 0.01, ###P < 0.001 vs. miR-9; $ P < 0.05 vs. Van; @ P < 0.05, @@ P < 0.01, @@@ P < 0.001 vs. miR-9 + Van + 3-MA. (f). The miR-9 expression levels after Van and 3-MA treatments. ***P < 0.001 vs. NC. (g–i). Transwell assays (g) of migration (top) and invasion (bottom) of HUVECs overexpressing miR-9 in response to vandetanib and/or 3-MA treatment. hVEGF (50 ng/ml) was used as a positive control. Mean ± SEM, n = 4. *P < 0.05, **P < 0.01 vs. NC. ##P < 0.01 vs. miR-9. (j–l). Tube formation (j), normalized tube length (k), and number of junctions (l) formed by HUVECs overexpressing miR-9 in response to vandetanib and/or 3-MA treatment. hVEGF was used as positive control. Mean ± SEM, n = 4. *P < 0.05, ***P < 0.001 vs. NC; ##P < 0.01, ###P < 0.001 vs. miR-9. (m). Schematic representation of inhibition of angiogenesis by the Flk1 inhibitor vandetanib via inhibition of VEGF secretion and activation of autophagy (the results shown in ), and adjuvant anti-autophagy treatment for anti-angiogenic vandetanib treatment.
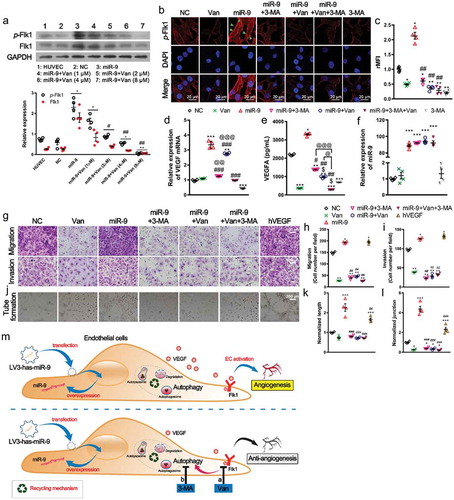
Figure 4. Inhibition of VEGFR (Flk1) or autophagy releases VEGF-enriched exosomes from HUVECs.
(a). Transmission electron microscopic view of control HUVEC and those overexpressing miR-9 and treated with vandetanib or 3-MA. Released extracellular vesicles (EVs) (red arrowhead) and intercellular junctions (blue arrowhead). At the upper left corner of each image, there is an enlarged view of likely EVs/EV-like structures indicated by the rectangular box. Their diameter values are shown in red. (b). Comparison of the intercellular gap distance under each case. Mean ± SEM, n = 10 gaps for each case. ***P < 0.001 vs. NC; #P < 0.05, ##P < 0.01 vs. miR-9; @P < 0.05 vs. miR-9 + Van. (c). Comparison of the amount of extracellular vesicles (EVs) under each case. Mean ± SEM, n = 4. EVs were observed by TEM and frequency distribution curve of diameter (interval 20 and range 0–1000) was performed by ImageJ. Chi-squared test was performed for EVs distribution. *P < 0.05 vs. NC; ##P < 0.01, ###P < 0.001 vs. miR-9. (d). Immunoblot for exosomal markers TSG101, HSP70 and CD63 in exosomes isolated from 2.5 mL culture supernatants from about 1 × 10⁷ HUVECs (left). The purity of exosome was assessed by GRP94. Densitometric quantification (right). Mean ± SEM, n = 4. *P < 0.05, **P < 0.01 vs. NC; ##P < 0.01 vs. miR-9. (e, f). Transmission electron microscopic view of isolated exosomes (e, average size 63 ± 15 nm, Mean ±SD; 78% vesicles in the range of 50–150 nm) and immunogold labelling of CD63 (f). (g). Nano-flow cytometry analysis of VEGF-positive exosomes released from HUVECs overexpressing miR-9 and following administration of vandetanib or 3-MA (exo1, left; exo2, right). (h). Immunoblot for VEGF in exosomes (10 μg proteins) isolated from HUVEC culture supernatant in the presence or absence of miR-9 overexpression and following administration of vandetanib or 3-MA (bottom). CD63 was used as a reference. Densitometric quantification (top). Control, HUVECs in the absence of treatment. Mean ± SEM, n = 3. *P < 0.05; **P < 0.01 vs. control; ###P < 0.001 vs. miR-9. (i). MiR-9 mRNA levels in exosomes. U6 snRNA and cel-miR-39 were used as endogenous and exogenous controls. Mean ± SEM, n = 3. ***P < 0.001 vs. NC. (j, k). Enzyme-linked immunosorbent assay of exosomal VEGF and VEGF in exosome-depleted media. Exosomal proteins were extracted using radioimmunoprecipitation assay lysis. Data was normalized to the volume of culture supernatants. Mean ± SEM, n = 4. *P < 0.05, **P < 0.01, and ***P < 0.001 vs. NC; #P < 0.05; ##P < 0.01, ###P < 0.001 vs. miR-9; @@ P < 0.01 vs. miR-9 + 3-MA. (l). Schematic representation of induction of release of VEGF-enriched exosomes by Flk1 inhibitor and anti-autophagy.
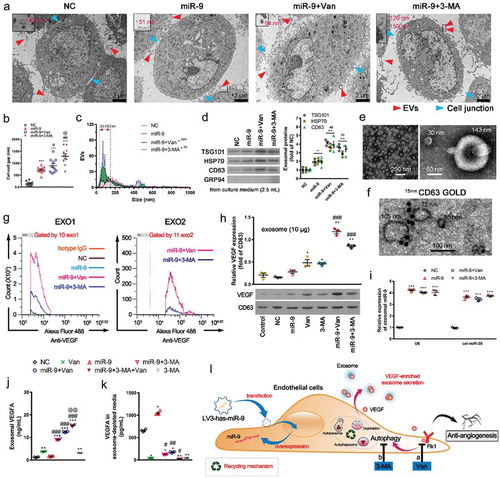
Figure 5. VEGF-enriched exosomes induce colony formation and vasculogenic mimicry (VM) by HCC cells.
(a). Colony formation and cell counts (per field of 961.6 mm2) of HuH7 (top) and SMMC-7721 cells (bottom) treated with exosomes from the supernatant of HUVECs overexpressing miR-9 and following administration of vandetanib or 3-MA in the presence of Bevacizumab (Bev). hVEGF was used as a positive control. (b). Tube formation pattern by HuH7 and SMMC-7721 cells treated with exosomes in the presence and absence of Bev. (c-f). Colony count of HuH7 (c) and SMMC-7721 (d) cells. Normalized tube length (to control) of HuH7 (e) and SMMC-7721 (f) cells. Mean ± SEM, n = 3. **P < 0.01; ***P < 0.001 vs. NC; @@P < 0.01, @@@P < 0.001 vs. Bev; #P < 0.05, ###P < 0.001 vs. miR-9. (g). Immunoblot for exosomal proteins from the culture supernatant of HUVECs with and witout miR-9 overexpression and following administration of vandetanib or 3-MA in the presence of 0.001% DMSO or 10 μM GW4869 for 48 h. Mean ± SEM, n = 3. *P < 0.05 vs. miR-9; @@P < 0.01 vs. miR-9 + GW4869. (h-j). Tube formation pattern (h) and normalized tube length of HuH7 (i) and SMMC-7721 (j) cells. HCC cells were co-cultured for 48 h with HUVECs that pretreated with vandetanib or 3-MA in the presence of 0.001% DMSO or 10 μM GW4869 for 48 h (sketch map). n = 3. **P < 0.01, ***P < 0.001 vs. NC; @P < 0.05, @@P < 0.01; @@@P < 0.001 vs. miR-9 + GW4869.
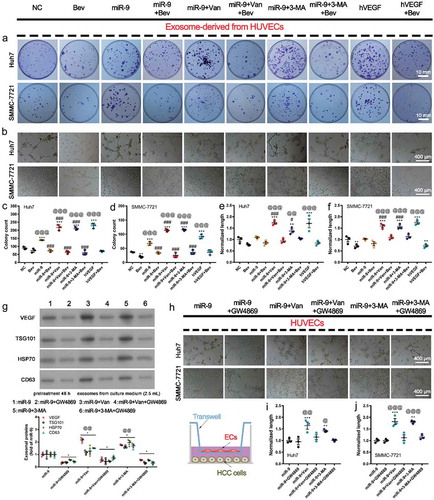
Figure 6. VEGF-enriched exosomes induce tumorigenesis and promote tumor vasculogenesis.
(a–c). In vivo tumorigenesis of SMMC-7721 cells (1.0 × 10⁷ in 500 μL Matrigel) inoculated with phosphate-buffered saline alone or with exosomes (12.5 μg/μl, a total of 100 μg) collected from HUVEC culture supernatant. Images of mice with tumors and harvested tumors after 21 days from SMMC-7721 cells implant (a). Red arrowheads indicate tumors. Tumor volume vs time (b) and tumor weight at 21 days after tumor cell implantation (c). Mean ± SEM, n = 4. *P < 0.05, **P < 0.01; ***P < 0.001 vs. PBS; #P < 0.05, ##P < 0.01 vs. miR-9; @P < 0.05 vs. miR-9 + 3-MA. (d). Endothelial vessels labeled with CD34 (yellow arrowhead) and VM vessels labeled with PAS (blue arrowhead). Data are representatives of three experiments with four animals per group. (e-g). Evaluation of number of endothelial vessels (e), and diameter (f). Area percentage of VM vessels (g). Mean ± SEM, six fields in 0.32 mm2 for each animal, four animals per group, n = 4. *P < 0.05, **P < 0.01; ***P < 0.001 vs. PBS; #P < 0.05, ##P < 0.01, ###P < 0.001 vs. miR-9; @@P < 0.01 vs. miR-9 + 3-MA.
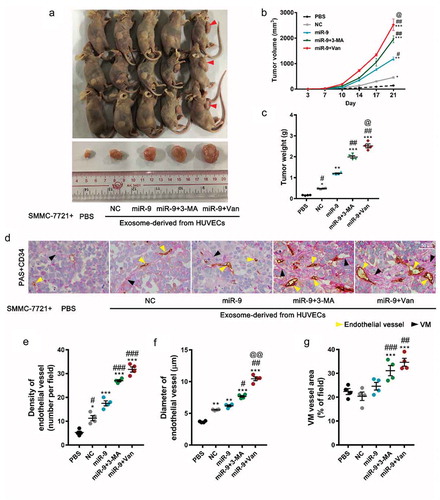
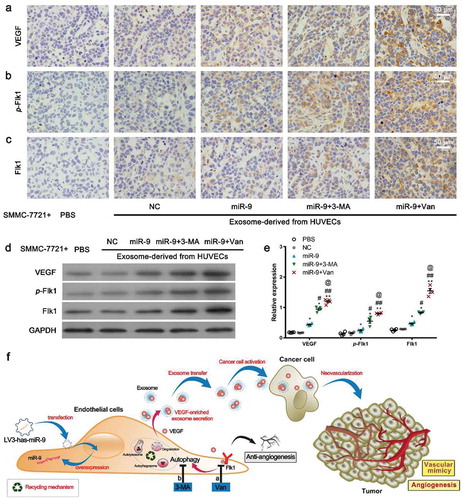
Figure 7. VEGF levels and Flk1 activation by VEGF-enriched exosomes.
(a–c). IHC for VEGF (a), p-Flk1 (b), and Flk1 (c) of xenograft tumors. Representatives of three experiments with four animals in each group. (d, e). Immunoblot for VEGF, Flk1, and p-Flk1 in xenograft tumors (d, 50 μg proteins from tumor lysates) and densitometric quantification (e). Mean ± SEM, n = 4. *P < 0.05, **P < 0.01 vs. PBS; #P < 0.05, ##P < 0.01 vs. miR-9; @P < 0.05 vs. miR-9 + 3-MA. (f). Schematic of the hypothetic mechanism for VEGF-enriched exosomes mediating cross-talk between endothelial cells and tumor cells and their promotion of tumor vasculogenesis after anti-angiogenesis and/or anti-autophagy actions. More VEGF-enriched exosomes were generated from the HUVECs treated with vandetanib than from those treated with 3-MA. As expected, anti-angiogenesis actions enhanced the tumor vasculogenesis more compared with anti-autophagy actions.