
Figures & data
Figure 1. Flow diagram of the research strategy.
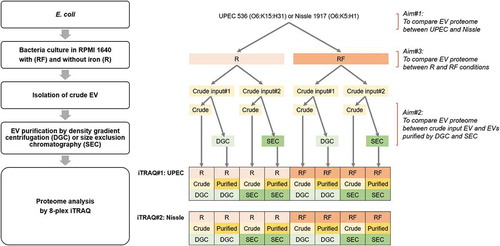
Figure 2. Comparison of EV protein profile between UPEC and Nissle by (a) Venn diagram, and the Gene Ontology (GO) enrichment analysis by (b) biological process, (c) cellular component and (d) molecular function. For the GO analysis, categories with Bonferroni-corrected p value <0.05 were selected. Fold enrichment greater than 1 indicates the over-represented category and less than 1 indicates the under-represented category.
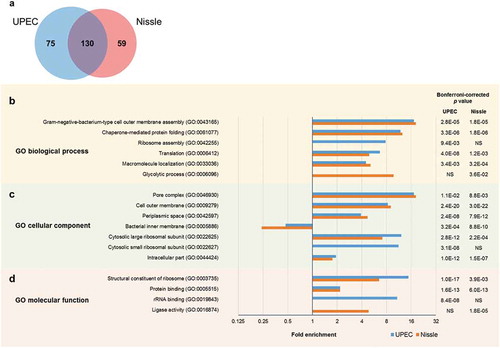
Table 1. Samples used in two 8-plex iTRAQ experiments.
Table 2. Summary of spectra, peptides and proteins identified and quantified in two 8-plex iTRAQ experiments.
Table 3. Key findings from iTRAQ#1 experiment on the UPEC EV proteins that compared three EV preparation methods (crude input for DGC or SEC purifications, DGC-purified and SEC-purified) in R (without iron) and RF (with iron) growth conditions. Comparison A) indicates a protein enriched by both DGC and SEC purification methods in iron-restricted condition. Comparison B) indicates proteins depleted by both DGC and SEC purification methods in iron-restricted condition. Comparison C) indicates a protein enriched by both DGC and SEC purification methods in iron-supplemented condition. Comparison D) shows a protein depleted by both DGC and SEC purification methods in iron-supplemented condition. Comparison E) indicates proteins enriched in iron-supplemented condition. Comparison F) indicates proteins enriched in iron-restricted condition. N is the rank of the specified protein relative to all other detected proteins (sorted by Unused ProtScore). The details shown below are based on the winner protein selected by the ProteinPilot software for the specific N.
Table 4. Key findings from iTRAQ#2 experiment on the Nissle EV proteins that compared 3 EV preparation methods (crude input for DGC or SEC purifications, DGC-purified and SEC-purified) in R (without iron) and RF (with iron) growth conditions. Comparison A) indicates a protein enriched by both DGC and SEC purification methods in iron-restricted condition. Comparison B) indicates proteins depleted by both DGC and SEC purification methods in iron-restricted condition. Comparison C) indicates a protein enriched by both DGC and SEC purification methods in iron-supplemented condition. Comparison D) shows a protein depleted by both DGC and SEC purification methods in iron-supplemented condition. Comparison E) indicates proteins enriched in iron-supplemented condition. Comparison F) indicates proteins enriched in iron-restricted condition. N is the rank of the specified protein relative to all other detected proteins (sorted by Unused ProtScore). The details shown below are based on the winner protein selected by the ProteinPilot software for the specific N.