Figures & data
Table 1. Strains of bacteria used in this study.
Table 2. Primer sequences used in this study.
Figure 1. Appearance, size, structure and stability of Bt OMVs. (a) Electron microscopy (EM) of Bt cells showing vesicles budding from their surface before release into the milieu (lines in left panel), and EM image of OMVs extracted from cell culture supernatants (right panel). (b) Immunodetection of naïve Bt OMVs using colloidal gold anti-rabbit Ig to detect binding of rabbit anti-Bt OmpA antisera (right panel). Left panel shows absence of staining of OMVs produced by an OmpA deletion mutant of Bt. (c) Size distribution of OMVs produced by Bt determined by nanoparticle tracking analysis. (d) Thermostability of OMVs at day 0 (OMV D0) and after storage of OMV suspensions at 4°C or 40°C for 30 days as measured using immunoblotting to detect OmpA in extracts of naïve OMVs (OMV) or OMVs of ompA deletion mutants (OMV-), and of neat (1) or ten-times concentrated (10) OMV storage buffer (SB) (PBS was the storage buffer).
Figure 2. Expression of heterologous proteins in Bt OMVs. (a) Schematic of cloning procedure for the export of proteins of interest into the lumen or at the surface membrane of OMVs. The secretion peptide of Bt OmpA (SP BtompA) is indicated in yellow and fused at the N-terminus of the gene of interest. (b and c) Determination of protein location after treatment with proteinase K (PK). Immunoblotting of StOmpA (b) and KGF-2 (c) with and without pre-treatment of OMV suspensions with proteinase K. NT: not treated; PK: + Proteinase K; B: PK buffer alone. (d) KGF-2 quantification within OMVs. Comparison of recombinant KGF-2 (1–100 ng) with 10 µl of 1 ml OMV suspension (S).
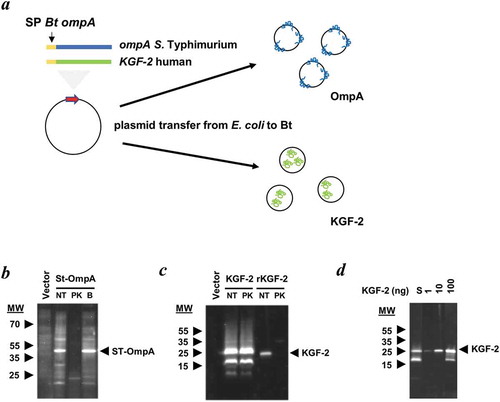
Figure 3. Intrinsic adjuvanticity of Bt OMVs. (a) Mice (n = 5) were intranasally adminstered PBS alone native Bt OMVs (OMV) in PBS and 5 days later heads and thoracic tissue was processed for immunohistology to visualise immune cell activation and formation of organised lymphoid tissue containing CD45R+ B cells (B220), CD3+ T cells (CD3) and macrophages/dendritic cells (Iba-1) in the nasal associated lymphoid tissue (a) the lung parenchyma (b) and mediastinal adipose tissues (c). Red arrows define nasal-associated lympoid tissue (NALT), bronchus-associated lymphoid tissue (BALT) and fat-associated lymphoid tissue (FALC) in a, b and c respectively. NC: nasal cavity, NS: nasal septum, P: hard palate.
Figure 4. Bt OMV-elicitied systemic and mucosal antibody responses. (a) Mice (n = 5–6/grp) were administered Bt OMVs expressing the Salmonella OmpA or SseB proteins via the oral (OG), intranasal (IN) or intraperitoneal (IP) routes according to the dosing regimen described in the Material and Methods section. Arrows indicate time of immunization. Naïve OMVs (nOMV) and PBS were administrated to mice (n = 5–6/grp) as control groups. At autopsy, serum (b) and brochoalveolar lavage fluid (BAL) (c) were analysed for anti-OmpA and anti-SseB IgG and IgA antibody titres, respectively, by ELISA. The boxplots indentify the mean and upper and lower quartile values for data sets obtained from animals within each treatment group. Analysis of variance for multiple comparisons of means between independent samples (ANOVA) was followed by a Tukey’s test. *P < 0.05; **P < 0.01; ***P < 0.001; ns,not significant. Total IgA levels were also determined in salivary gland tissue homogenates (d) and in BAL (e) samples from each group of animals by ELISA using IgA standards as described in the Materials and Methods section.
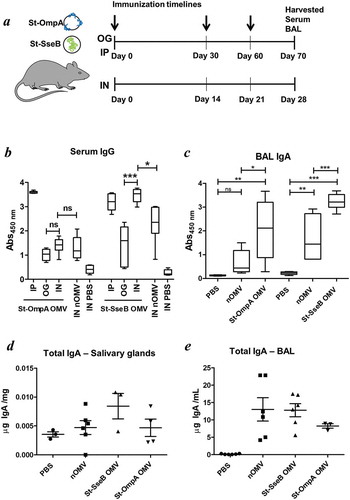
Figure 5. Bt OMVs expressing IAV H5F protein confer a level of protection to virus infection in mice. (a) Mice were immunised intranasally with H5F-OMVs in PBS; controls were administered intranasally with naïve OMVs or PBS alone (mock) at the indicated time-points; after 28 days all were challenged intranasally with a 10-fold lethal dose of IAV strain A/PR/8/34 (PR8, H1N1). At necropsy serum (b) and brochoalveolar lavage fluid (BAL) (c, d) were analysed for IAV IgG and IgA antibodies by ELISA using UV-inactivated PR8 virus. BAL samples were also analysed for H5 HA specific IgA antibodies (e) using recombinant H5 HA as the target antigen. Immune serum and BAL from PR8 IAV-infected mice (PR8) were used as reference samples. (f) The weight of individual animals in each group was assessed daily. (g) Lung homogenates were assessed for viral load (PFU/g lung tissue) at necropsy. Statisitical analysis was performed using one-way ANOVA with Tukey’s multiple comparison tests (panels b,c,d,e,g) or two-way ANOVA with Bonferroni post-tests. ns, not significant; *P < 0.05; **P < 0.01; ***P < 0.001.
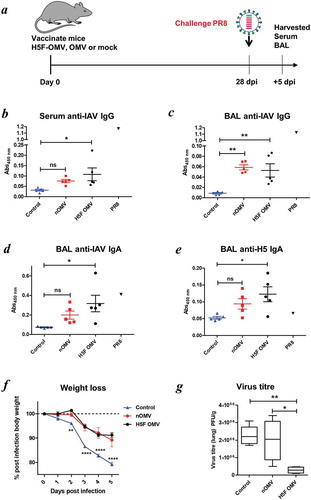
Figure 6. OMVs containing KGF-2 ameliorate DSS-induced colitis in mice. (a) Groups of mice were provided with drinking water with or without 2.5% (w/v) DSS for 7 days. On days 1, 3 and 5 mice were orally gavaged with either PBS, naïve OMVs or OMVs containing KGF-2. (b) Percent weight loss at day 7. (c) Colon length at day 7. (d) Disease Activity Index (DAI) at day 7. (e) Representative images of colons. Data expressed as mean ± SD (n = 5). Statisitical analysis was performed using one-way ANOVA with Tukey’s multiple comparison tests. Mice gavaged with PBS and receiving regular drinking water were considered as the reference group for statistical analysis. ns, not significant; *P < 0.05; **P < 0.01; ***P < 0.001.
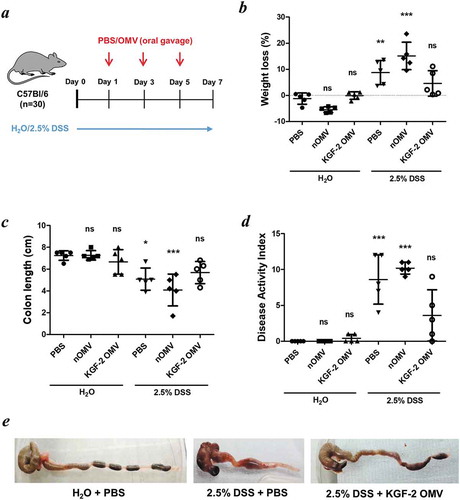
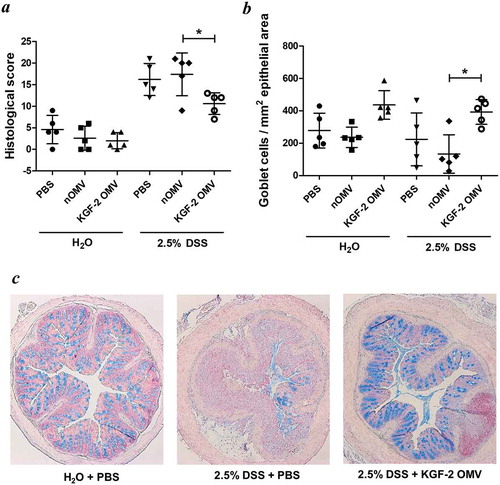
Figure 7. OMVs containing KGF-2 protect and restore goblet cells in mice with DSS-induced colitis. (a) Histological score of colon tissue as determined by microscopy of H&E stained sections obtained at necropsy. (b) Number of Alcian Blue stained goblet cells per mm2 of epithelial area. (c) Microscope images of goblet cell distribution in representative colon sections stained with Alcian Blue. Data expressed as mean ± SD (n = 5). Statisitical analysis was performed using one-way ANOVA with Tukey’s multiple comparison tests. *P < 0.05.