Figures & data
Figure 1. EVs in melanoma metastases tissue interstitial space were isolated and characterized. (a) Melanoma metastatic tissue consisted of cells containing melanin accumulations and EVs. Higher magnification pictures showed numerous different types of EVs in the tissue interstitial space. (b-e) Characterization of 16.5k and 118k EVs. Electron microscope images of 16.5k (b) and 118k (d) EVs. The 16.5k EVs have a size range of 100–300 nm, and the 118k EVs have a diameter of approximately 40–100 nm. RNA profiles of 16.5k (c) and 118k (e) EVs. The 16.5k EVs have prominent 18S and 28S ribosomal RNA peaks, whereas the 118k EVs have small RNA with no or very small ribosomal RNA peaks.
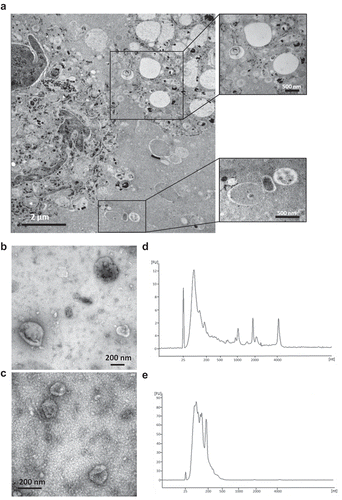
Figure 2. Proteomic analysis of EVs reveals the existence of mitochondrial membrane proteins. (a) Only membrane-localized proteins that were identified from five melanoma tissue-derived EVs (MeT1- to MeT5-EVs) were selected and compared. Numbers with red colour are proteins that were identified in at least 4 MeT-EVs. (b) Membrane proteins from MeT-EVs were compared with membrane proteins from non-melanoma-EVs. Common proteins were categorized by 10-fold difference of relative abundance. (c) The sub-cellular localization of 236 candidates was analyzed. The percentage was shown. (d) Mitochondrial membrane proteins were plotted with their relative abundance from a mass spectrometry analysis and their identification count from the EVpedia database. Blue colour is the final three candidates for validation. IC; identification count. (e-g) Three mitochondrial membrane proteins – COX6c (e), SLC25A22 (f), and MT-CO2 (g) – were experimentally validated with direct ELISA. Data are presented as the mean ± SD. ***p < 0.001.
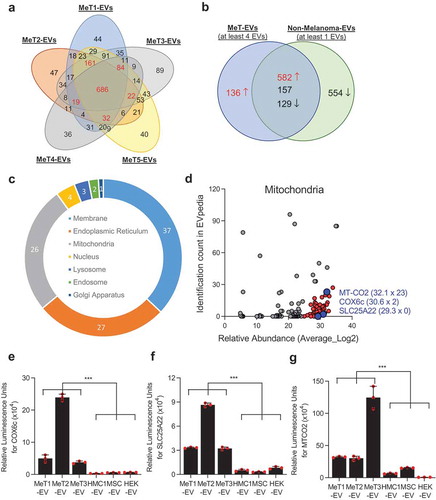
Figure 3. Subpopulations of EVs harbour mitochondrial proteins. (a-c) Subpopulations of EVs were isolated with antibodies against FACL4 or MT-CO2, and their proteomes were analyzed. The identified proteins were compared by Venn diagram (a) and heatmap analysis (b). Based on relative abundance of proteins, five different clusters were identified (b), and gene ontology analysis was performed for 4 of the 5 clusters (c). FACL4-EVs and/or MTCO2-EVs clusters enriched with metabolic process-related proteins are shown in red boxes. (d) ATP synthase activity was measured for EVs and MTCO2-EVs. Data are presented as the mean ± SD. *p < 0.05.
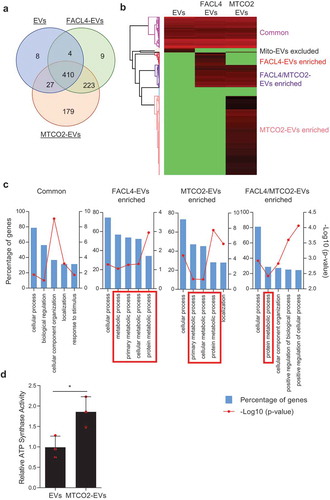
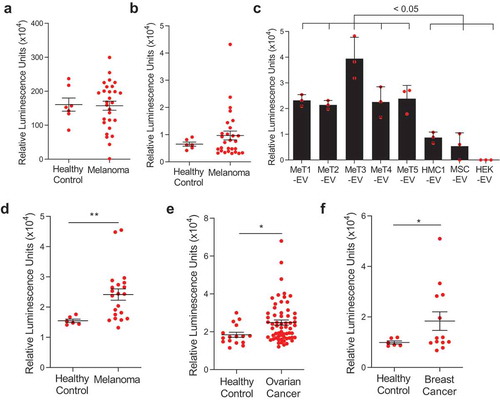
Figure 4. Mitochondrial membrane proteins on the surface of EVs are unique biomarkers for cancer. (a,b) The levels of mitochondrial inner membrane proteins, MT-CO2 (a) and COX6c (b) were examined in plasma healthy and melanoma patients. (c) The sandwich ELISA system was validated with melanoma tissue-derived EVs and non-melanoma-derived EVs. Data are presented as the mean ± SD. (d-f) The levels of mitochondrial proteins (MT-CO2 and COX6c) were examined in blood plasma from melanoma patients (n = 21) (d), ovarian cancer patients (n = 62) (e), and breast cancer patients (n = 13) (f). Healthy control was six. Whiskers show the minimum-maximum and lines inside box represent the median. *p < 0.05, **p < 0.001.