Figures & data
Figure 1. The L1-EGFP retrotransposition model. (a) Representative images of MM231 and HCT116 cell lines transfected with L1-EGFP or L1mut-EGFP. GFP fluorescence is only detected when there is an active L1-EGFP retrotransposition event. Scale bars represent 200 µm. (b) Primers designed to detect L1 (249 bp) and spliced EGFP RNA (EGFP-I; 345 bp) in the L1-EGFP construct. (c) mRNA expression of EGFP-I and (d) L1 in WT, L1-EGFP, and L1mut-EGFP cells relative to GAPDH. N = 3 wells in 6-well plate. Error bars represent SD.
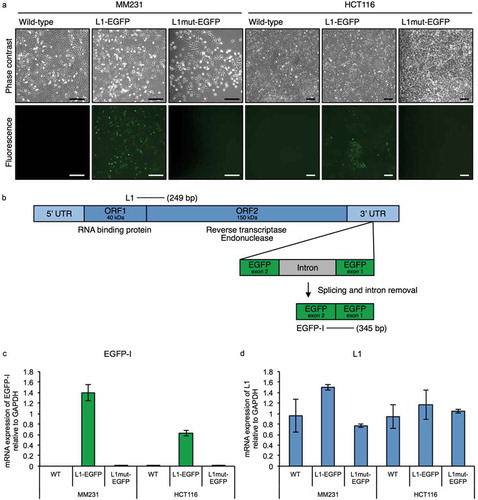
Figure 2. Epigenetic silencing of L1-EGFP retrotransposition events. (a) Fluorescent images of MM231 L1-EGFP and HCT116 L1-EGFP cell lines. Passage number after selection of EGFP expressing cells by FACS is indicated in the upper left corner. P, passage number. Scale bars represent 200 µm. (b) EGFP-I RNA expression in MM231 L1-EGFP and HCT116 L1-EGFP cell lines over time. EGFP-I expression was normalized to GAPDH and is shown as the fold change relative to P + 3 cells. (c) Fluorescent and phase contrast images of late-passage MM231 L1-EGFP and HCT116 L1-EGFP cell lines 14 hours after treatment with 100, 500 and 1000 nM of TSA. Scale bars represent 200 µm. (d) Percentage of EGFP positive cells in (c). (e) EGFP-I RNA expression following TSA treatment in MM231 L1-EGFP cells. EGFP-I expression was normalized to GAPDH and is shown as the fold change relative to 0 nM TSA. N = 3 wells in 6-well plate. Error bars represent SD. *, P < 0.05; NS, not significant; Dunnett’s test.
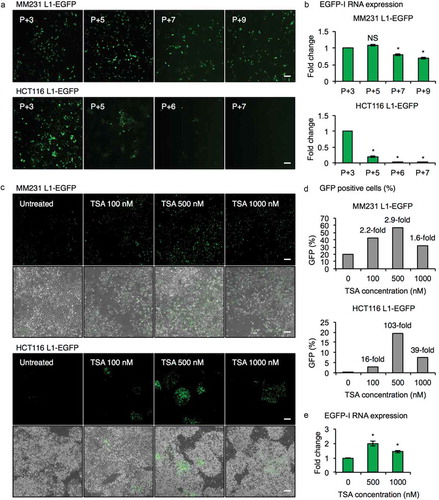
Figure 3. Characterization of MM231 L1-EGFP EVs. (a) Exosomes (50–150 nm) and MVs (~800 nm) were isolated from the supernatant of MM231 L1-EGFP cells by a series of filtration and ultracentrifugation steps. (b) Particle size distribution plot of isolated exosomes and MVs measured by nanoparticle tracking analysis. Particle diameter in nanometers on the x-axis is plotted against particle concentration on the y-axis. Particle concentration is estimated based on scattering volume calculated from the dimensions of the field of view and the depth of the laser beam. The total concentration of particles and mode size is displayed on the upper right. All samples were analyzed using the same parameters. (c) Protein from whole cell lysates, exosomes, and MVs from MM231 L1-EGFP cells were separated on SDS-PAGE gels, followed by Western blotting using antibodies against CD9, CD63, GFP, L1TD1 and GAPDH. Equivalent amount of protein (800 ng) was loaded for each sample. (d) Bioanalyzer electropherogram of RNA extracted from MM231 L1-EGFP exosomes and MVs. The x-axis indicates the length of the RNA in nucleotides (nt) and the y-axis indicates fluorescence intensity in arbitrary units. The lowest peak at 25 nt indicates the lower size marker. FU, fluorescent unit. (e) Measurement of exosome and MV RNA by Qubit RNA BR assay kit, normalized to cell number (1 × 10⁶ cells). (f, g) Expression levels of EGFP-I and L1 RNA in MM231 L1-EGFP exosomes and MVs. Expression levels were normalized to GAPDH and are shown as the fold change relative to exosome RNA. CT, cycle threshold value. (h) Abundance of L1 RNA relative to GAPDH RNA in MM231 L1-EGFP EVs. (i) The ratio of L1 to GAPDH RNA was compared in RNA extracted from MM231 L1-EGFP cells and EVs. The data is shown as ratio of L1 to GAPDH RNA relative to cell. N = 3, error bars represent SD. *, P < 0.05; t-test.
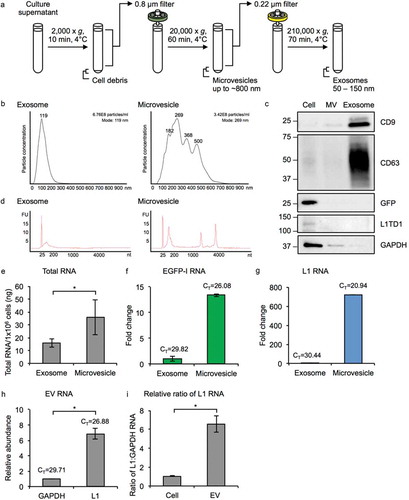
Figure 4. L1-EGFP RNA is transferred to recipient cells. (a) A co-culture system was used to assess the transfer of EGFP-I RNA to MM231 recipient cells using 0.4 and 1.0 µm transwells for 14 days. RNA was collected from MM231 recipient cells and analyzed for EGFP-I RNA by qRT-PCR. EGFP-I expression was normalized to GAPDH and is shown as the fold change relative to EGFP-I RNA in recipient cells with the 0.4 µm transwell. CT, cycle threshold value; N.D., not determined. (b) Representative images of MM231 cells co-cultured with MM231 L1-EGFP or (c) MM231 GFP cells using a 1.0 µm transwell for 21 days. Scale bars represent 100 µm. (d) PCR analysis of genomic DNA with primers flanking the intron in the EGFP reporter gene (345 bp). PCR products were analyzed on a 2% agarose gel. Lane 1, DNA ladder; lane 2, MM231 WT; lane 3, MM231 L1-EGFP; lane 4, MM231 recipient cells co-cultured with MM231 GFP; lane 5, MM231 recipient cells co-cultured with MM231 L1-EGFP. (e) Sequence analysis for L1-EGFP DNA, recipient cell DNA, and reference EGFP-I sequence. Genomic DNA was extracted from MM231 L1-EGFP cells and MM231 recipient cells co-cultured with MM231 L1-EGFP cells after 21 days. Alignment of partial sequences of EGFP is shown. The position of the splice site is indicated with an arrow. N = 3 wells in 6-well plate, error bars represent SD.
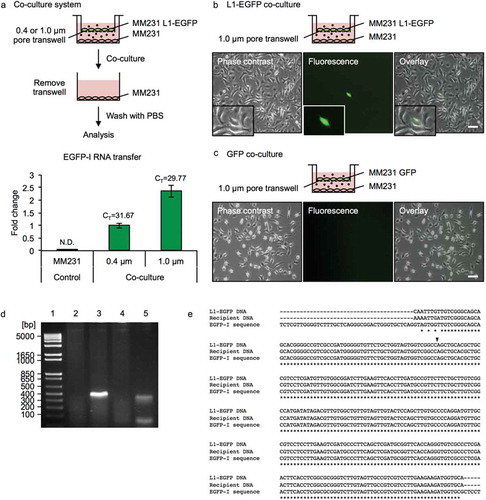
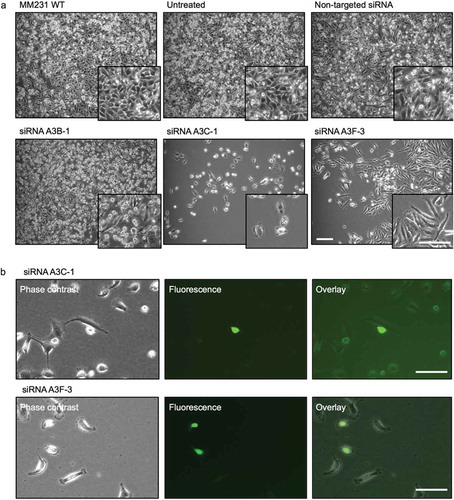
Figure 5. APOBEC3 genes are upregulated in L1-EGFP recipient cells. (a) Expression levels of A3B, A3C and A3F RNA in MM231 cells co-cultured with MM231 L1-EGFP cells. Expression levels were normalized to GAPDH and are shown as the fold change relative to MM231 cells without co-culture. CT, cycle threshold value of each APOBEC3 genes are shown. (b) Expression levels of A3B, A3C and A3F RNA in MM231 cells after siRNA-mediated knockdown of APOBEC3 genes. Expression levels were normalized to GAPDH and are shown as the fold change relative to MM231 untreated cells. (c) Expression levels of A3B, A3C and A3F in MM231 cells co-cultured with L1-EGFP cells after siRNA-mediated knockdown of APOBEC3 genes. Expression levels were normalized to GAPDH and are shown as the fold change relative to MM231 WT cells. (d) Whole cell lysates of MM231 cells and MM231 cells co-cultured with MM231 L1-EGFP cells were separated on SDS-PAGE gels, followed by Western blotting using antibodies against A3B, A3C, A3F and GAPDH. Equivalent amount of protein (20 µg) was loaded for each sample. (e) Whole cell lysates of MM231 untreated cells and MM231 cells transfected with non-targeted (control) siRNA, A3B-1, A3C-1, and A3F-3 siRNA were separated on SDS-PAGE gels, followed by Western blotting using antibodies against A3B, A3C, A3F and GAPDH. Equivalent amount of protein (20 µg) was loaded for each sample. N = 3 wells in 6-well plate. Error bars represent SD. *, P < 0.05; Dunnett’s test.
Figure 6. L1-EGFP retrotransposition after knockdown of APOBEC3 genes. (a) Images of MM231 cells co-cultured with L1-EGFP cells after siRNA-mediated knockdown of APOBEC3 genes. (b) EGFP expression in A3C-1 and A3F-3 siRNA transfected cells co-cultured with L1-EGFP cells for 21 days. All scale bars represent 100 µm. N = 3 wells in 6-well plate.