Figures & data
Table 1. Clinical characteristics of CC patients and noncancerous controls.
Figure 1. Isolated sEVs enriched fractions from participants’ plasma. A. TEM images showed that sEVs were oval or bowl-shaped capsules without the nucleus (left panel: a wide field encompassing multiple vesicles; right panel: a close-up image of single vesicles). B. NTA results suggested that sEVs enriched from plasma were about 75-200nm in diameter. C. sEV markers CD63, TSG101 and Alix were all detected in the sEVs enriched fractions isolated from the plasma, and Calnexin, a negative marker of sEV was absent in our isolated sEVs enriched fraction samples. D. A box plot comparing the RNA concentration (ng per mL plasma) of sEVs enriched fractions isolated from CC and NC groups. E. A box plot comparing the RNA concentration (ng per mL plasma) of total plasma from CC and NC groups. F. A box plot comparing the sEVs enriched fractions-RNA percentage between CC and NC groups.
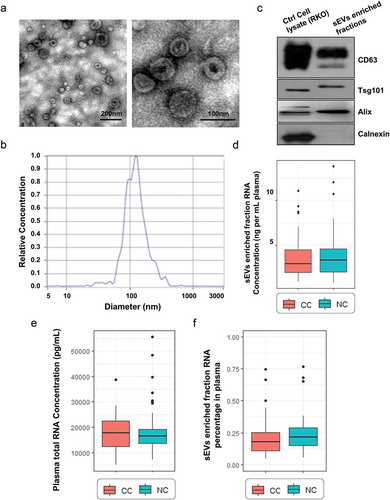
Figure 2. sEVs enriched fractions derived miRNAs profiles of CC and NC groups. A. A Venn diagram showed DEMs shared between TCGA dataset and our plasma sEVs enriched fractions miRNA dataset. B. A heatmap of the 60 DEMs’ expression level across all 25 samples in our plasma sEVs enriched fractions miRNA dataset. C. The specificity and sensitivity of each DEMs in identifying CC patients in our plasma sEVs enriched fractions miRNA dataset. D. The specificity and sensitivity of each DEMs in identifying CC patients in TCGA miRNA dataset.
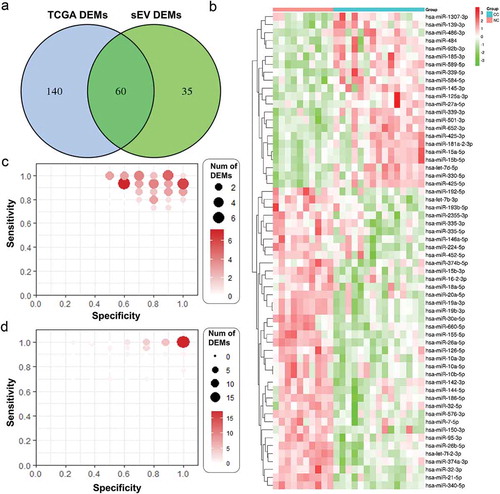
Table 2. Top 24 miRNAs ranked by Sensitivity × Specificity (miRNA-seq data).
Figure 3. Target analysis of differentially expressed miRNAs in the plasma sEVs enriched fractions of CC and NC groups. GO/KEGG enrichment of mRNAs targeted by the 60 DEMs identified in our plasma sEVs enriched fractions miRNA analysis was performed. A. A bubble plot of GOs (Biological Process) enriched. B. A bubble plot of GOs (Cellular Component, Molecular Function) enriched. C. A bubble plot of KEGG pathways enriched. D. A barplot showed the numbers of DEMs targeted genes in each KEGG pathways (targeted genes >10).
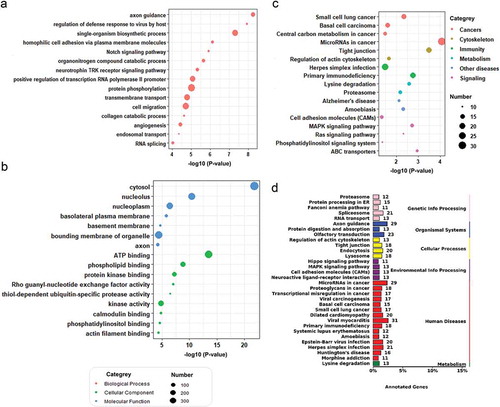
Table 3. Information of the selected miRNAs for RT-qPCR verification.
Figure 4. EV-associated characteristic evaluation of candidate miRNAs. A. Coomassie blue staining showed the total protein level in both plasma and sEVs enriched fractions when treated by Proteinase K and RNase A. B. Representative Agilent 2100 Bioanalyzer results of sEVs enriched fractions derived RNA with (lower panel) and without (upper panel) the pretreatment of Proteinase K and RNase A before RNA extraction procedure. C. Representative Agilent 2100 Bioanalyzer results of total plasma derived RNA with (lower panel) and without (upper panel) the pretreatment of Proteinase K and RNase A before RNA extraction procedure. D. Let-7b-3p, miR-150-3p, miR-145-3p, miR-139-3p levels detected from sEVs enriched fraction samples with and without the pretreatment of Proteinase K and RNase A. E. miR-21-5p and miR-30a-5p levels detected from sEVs enriched fraction samples with and without the pretreatment of Proteinase K and RNase A. F. Let-7b-3p, miR-150-3p, miR-145-3p, miR-139-3p levels detected from plasma samples with and without the pretreatment of Proteinase K and RNase A. G. miR-21-5p and miR-30a-5p levels detected from plasma samples with and without the pretreatment of Proteinase K and RNase A.
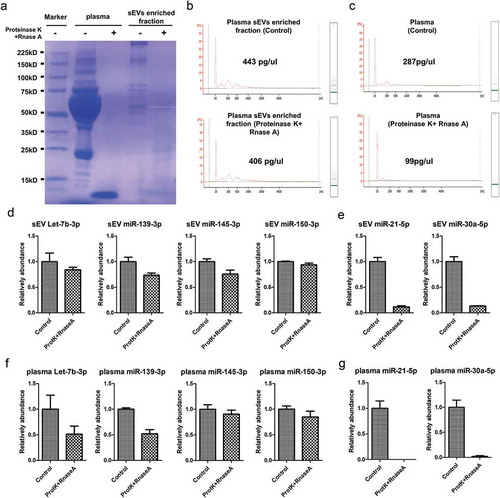
Figure 5. Verification of sEVs derived miRNAs as biomarkers of early CC. Verification of sEVs derived hsa-let-7b-3p (A), hsa-miR-150-3p (B), hsa-miR139-3p (C), hsa-miR145-3p (D) as biomarkers of early CC. The ROC curves of the testing dataset (miRNA sequencing of 25 samples) were shown in red, while the ROC curves of validation dataset (miRNA RT-qPCR of 134 samples) were shown in turquoise.
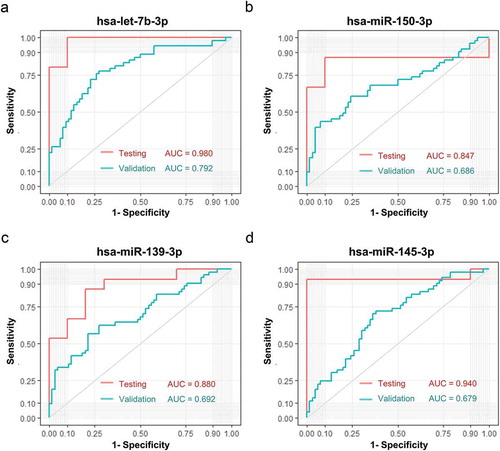
Figure 6. Performance of sEV miRNA panels as biomarkers of early CC. Verification of panel 1 (A, let-7b-3p + miR-139-3p), panel 2 (B, let-7b-3p + miR-145-3p), panel 3 (C, let-7b-3p + miR-139-3p + miR-145-3p), panel 4 (D, let-7b-3p + miR-139-3p + miR-145-3p + miR-150-3p) as biomarkers of early CC. The ROC curves of testing dataset (miRNA sequencing of 25 samples) were shown in red, while the ROC curves of validation dataset (miRNA RT-qPCR of 134 samples) were shown in turquoise.
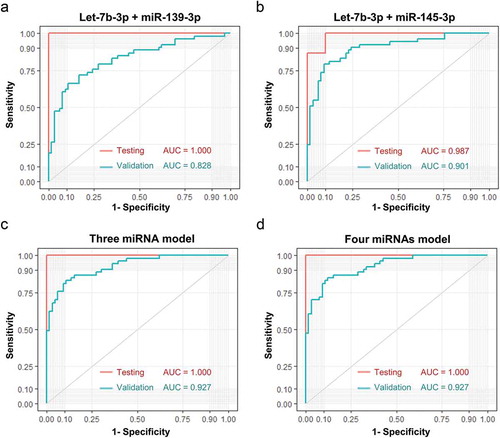
Figure 7. Comparison between sEVs derived miRNAs and plasma total miRNAs. A. Total plasma level of miR-139-3p was not associated with the plasma sEVs derived miR-139-3p (Pearson χ2 = −0.111, p = 0.912). B. The ROC curves of sEVs derived miR-139-3p (green), plasma total miR-139-3p (blue) and a logistic model combined them together (red). C. Total plasma level of miR-145-3p was not associated with the plasma sEVs derived miR-145-3p (Pearson χ2 = −1.138, p = 0.258). D. The ROC curves of sEVs derived miR-139-3p (green), plasma total miR-145-3p (blue) and a logistic model combined them together (red). E. Total plasma level of let-7b-3p was not associated with the plasma sEVs derived let-7b-3p (Pearson χ2 = 1.544, p = 0.126). F. The ROC curves of sEVs derived let-7b-3p (green), plasma total let-7b-3p (blue) and a logistic model combined them together (red). E. Total plasma level of miR-150-3p was not associated with the plasma sEVs derived miR-150-3p (Pearson χ2 = 0.577, p = 0.565). F. The ROC curves of sEVs derived miR-150-3p (green), plasma total miR-150-3p (blue) and a logistic model combined them together (red).
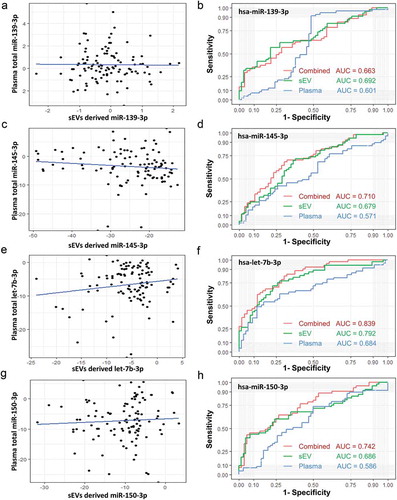
Figure 8. Diagnostic efficacy comparison between sEVs derived miRNAs panels and plasma total miRNAs panels. Evaluation of panel 1 (A, let-7b-3p + miR-139-3p), panel 2 (B, let-7b-3p + miR-145-3p), panel 3 (C, let-7b-3p + miR-139-3p + miR-145-3p), panel 4 (D, let-7b-3p + miR-139-3p + miR-145-3p + miR-150-3p) as biomarkers of early CC. The ROC curves of sEVs derived miRNAs data were shown in red, while the ROC curves of plasma total miRNAs data were shown in turquoise.
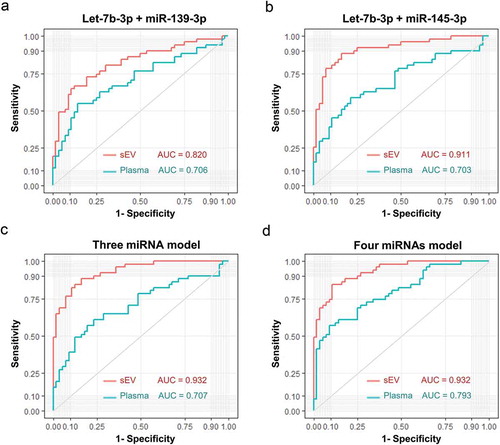
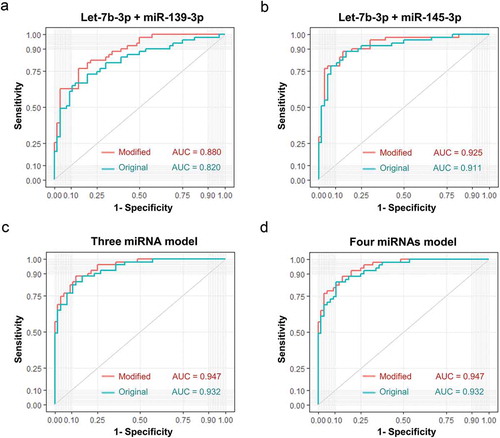
Figure 9. Diagnostic efficacy comparison between sEVs derived miRNAs panels with and without integrating their total plasma miRNA rivals. Evaluation of panel 1 (A, let-7b-3p + miR-139-3p), panel 2 (B, let-7b-3p + miR-145-3p), panel 3 (C, let-7b-3p + miR-139-3p + miR-145-3p), panel 4 (D, let-7b-3p + miR-139-3p + miR-145-3p + miR-150-3p) as biomarkers of early CC. The ROC curves of original sEVs derived miRNAs model were shown in turquoise, while the ROC curves of a modified model integrated original sEVs derived miRNAs with their total plasma rivals were shown in red.