Figures & data
Table 1. Lectin specificity.
Figure 1. Glioblastoma cell line-derived EV isolation and characterization for EV surface glycan analysis. (a). EV isolation procedure by differential centrifugation from U87- and GBM8-conditioned medium. (b). Expression of CD63 on EVs by immuno-gold transmission electron microscopy (TEM) with a magnification of 24,500 x. Primary staining with anti-CD63 followed by protein A coupled to 15 nm gold nanoparticles. (c). CD63 ELISA on a titration of EVs adsorbed to a solid phase. (d). Measurement of EV diameter, determined on TEM micrographs with a magnification of 24,500 x (CD63 immuno-gold staining, N = 100 EVs measured at random). (e). Quantification of the diameter of 100 randomly selected EVs in nm per size category, measured in eight TEM images. (f). Quantification of the relative distribution of EV diameter in percentage per size category, determined on TEM in D. (g). Relative size distribution measured by nanoparticle tracking analysis (NTA).
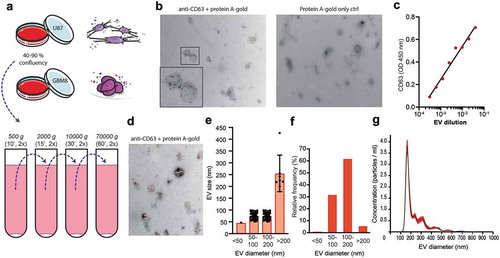
Figure 2. The surface glycoconjugates of glioblastoma cell line-derived EVs are dominated by sialic acid-capped N-glycans and bi-antennary glycans. (a). Lectin-binding ELISA (HPA, MAL-I, MAL-II, SNA, ConA, LTA, GNA, NPA) on a titration of U87 EVs adsorbed to a solid phase (carbohydrate specificity in brackets and in ). (b). Immuno-gold TEM pictures of U87 and GBM8 EVs stained with the same biotinylated lectins and streptavidin conjugated to 15 nm gold nanoparticles.
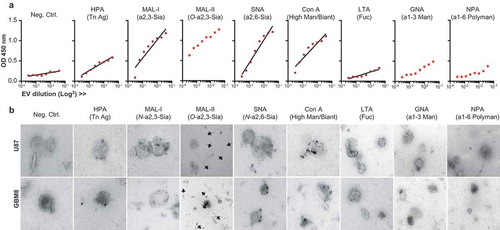
Figure 3. Glioblastoma-derived EVs bind Siglec-9, not DC-SIGN. (a). Siglec-binding ELISA on U87-derived EVs adsorbed to a solid phase. Screen for binding of recombinant Siglec-3, −7, −9 and −10 constructs (N = 3). (b). Absence of calcium-dependent DC-SIGN binding to ligands on U87-derived EVs by DC-SIGN binding ELISA on a titration of EVs adsorbed to a solid phase (N = 3). (c-d). DC-SIGN binding to polyacrylamide (PAA)-coupled LeX and -LeY glycoconjugates by DC-SIGN binding ELISA on titrations of PAA-LeX and PAA-LeY adsorbed to a solid phase (N = 3). (e). Schematic representation of possible uptake of glioblastoma EVs by DCs via Siglec 9, not DC-SIGN.

Figure 4. Chemo-enzymatic glycan modification for receptor-mediated targeting to dendritic cells. (a). Palmitoyl-LeY synthesis. (b). MS spectrum of palmitoyl-LeY. (c). MSMS spectrum of palmitoyl-LeY with peaks representing: 1074 = palmitoyl-LeY – H2O, 946 = palmitoyl-LeY – fucose, 658 = LeY, 511 = fucose(glcnac-gal). (d). Schematic representation of the fluorescent labelling and glycan modification of EV preparations by treatment with pan-sialic acid hydrolases and postinsertion of palmitoyl-LeY.
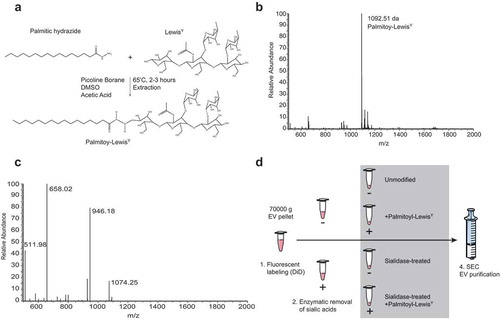
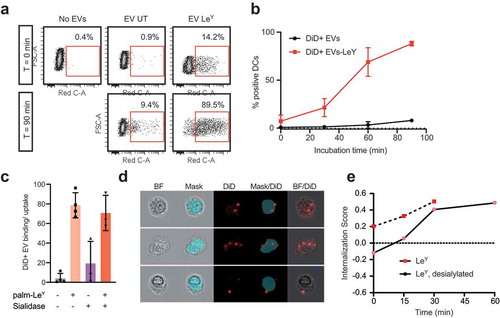
Figure 5. Glycan modification of EVs resulted in altered glyco-phenotypes. (a). Glycan modification resulted in enhanced recognition by DC-SIGN and less expression of sialic acids, measured by immuno-gold TEM. (b). Chemo-enzymatic modification of EVs resulted in enhancement of DC-SIGN binding in the palmitoyl-LeY incorporated EVs and a decrease in sialylation in the sialidase-treated EVs, measured by lectin-binding ELISA on EVs adsorbed to a solid phase (independent validations in Supplementary Figure 4). (c). Uptake of GBM-derived DiD-labelled EVs by MoDCs, measured as % DiD+ moDCs by FACS (three donors).
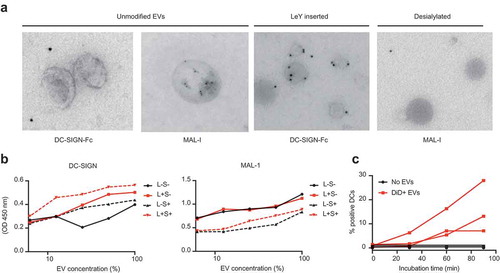
Figure 6. Glycan modification of EVs improved internalization by DCs. (a). Dot plots showing binding/uptake of unmodified or LeY-incorporated DiD+ EVs by moDCs after 30 min incubation at 4°C (T = 0) or after 90 min incubation at 37°C (T = 90) measured by FACS, representative of three donors. (b). Percentage DiD+ moDCs after incubation with unmodified or LeY-incorporated DiD+ EVs for 30 min at 4°C (T = 0). MoDCs were fixed after 0, 30, 60, or 90 min incubation at 37°C and DiD signal was measured by imaging flow cytometry (three donors). (c). Binding/uptake of EVs by moDCs (three donors), measured by imaging flow cytometry. (d). Representative imaging flow cytometry brightfield (BF) pictures of moDCs with DiD positive spots on the outside and inside of cells. Blue area masks inside area of cells, and colocalization of DiD signal with the mask was used to calculate internalization scores. (e). Internalization of EVs by moDCs in a pulse-chase experiment with cells fixed in PFA after 15, 30, 45 and 60 min incubation at 37°C visualized in one donor by imaging flow cytometry.