Figures & data
Figure 1. TGFβ-1 co-localizes with exosomes. (a) Exosomes isolated from HMC-1 were floated on iodixanol density gradients, and the expression of TGFβ-1 (ELISA) and the exosome-enriched proteins TSG101 and CD81 (immunoblotting) were measured (n = 3, volume = 600 ml). (b) Percentage of inactive and active forms of TGFβ-1 measured on the mast cell-derived exosomes (n = 3). (c) Amount of inactive and active forms of TGFβ-1 on the mast cell-derived exosomes was measured per unit of CD63-positive exosomes using ELISA. Data are presented as means ± SEM (n = 3). (d) Quantitative measurements of the distribution of TGFβ-1-AF647 (Red) and CD63-PE (Green) on single exosomes using fluorescence correlation spectroscopy (FCS). Excitation was at both 488 nm and 594 nm. The width of the signal, extending to more than 500 ms, corresponds to vesicle diameters. (e) Exosomes were first floated on a density gradient and then incubated on a CD63 antibody-coated on plate, and finally, the relative luminescence signal of TGFβ-1 was measured using the sandwich ELISA approach (n = 3, volume = 200 ml).
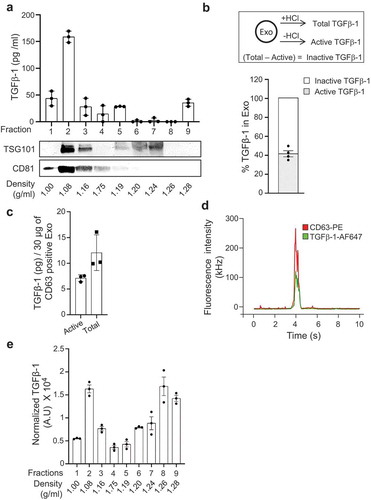
Figure 2. Glycan-based association of inactive TGFβ-1 on exosomes. The presence of TGFβ-1 was evaluated on exosomes isolated with a pelleting-free protocol from HMC-1 cells (see Supplementary Figure 3A). (a) Presence of TGFβ-1 on exosomes treated with trypsin (0.125%) measured by ELISA. (b,c) Exosomes treated with Heparinase-II and trypsin and re-floated were evaluated for the presence of TGFβ-1 and the presence of surface (CD81) and luminal (β-actin) markers on exosomes (n = 3, volume = 100 ml). (d) Level of TGFβ-1 on exosomes after competitive inhibition of glycan biosynthesis by the addition of pNP-Xyl (n = 1, volume = 600 ml; n = 2, 3 volume = 200 ml).
Figure 3. Mast cell-derived exosomes enhance the migration of primary human mesenchymal stem cells. (a) Morphology of MSCs incubated with exosomes derived from HMC-1 cells. (b) An in vitro wound healing scratch assay was performed on monolayers of untreated or exosomes-treated MSCs (n = 2) that were derived from HMC-1 cells. MSCs were imaged at 24 h and 48 h after injury. (c) Expression of MMP-9 and MMP-2 transcripts in MSCs after exosome treatment using quantitative polymerase chain reaction. w.r.t; with respect to. (d) Gelatinolytic activity in secreted supernatant from MSCs estimated by zymography to detect MMP-2 and MMP-9 activity. (e) The migration activity of the exosome-treated MSCs towards different concentrations of FBS evaluated using a Boyden chamber migration assay. Data are presented as means ± SEM; n = 4; ** p ≤ 0.01.
Figure 4. Exosomes activate SMAD signalling in human mesenchymal stem cells. (a) Exosomes (100 µg/ml) activate the TGFβ-1 signalling axis by phosphorylation of SMAD2 as identified by immunoblotting at different time points. (b,c) Activation is visualized by immuno-fluorescent imaging of the translocation of SMAD2 into the nucleus (b) and is quantified by the relative intensity measurement (c) in MSCs 30 min after exosome exposure. (d) Activation of transcripts downstream of SMAD2, such as TGFB1, was evaluated in MSCs at 24 h and 48 h after exosome exposure. (e,f) Exosomes from TGFβ-1 knockout HMC-1 cells were used to induce phosphorylation of SMAD2 in MSCs as measured using immunoblotting (e) and as measured by their capacity to induce migration towards FBS (f). (g) Migration capacity of MSCs towards FBS after exosome treatment was also evaluated in the presence of a blocking antibody against TGF-β-1, 2, 3 using a Boyden chamber migration assay. (h) Secretion of TGFβ-1 in MSCs was measured in the presence of the TGFR-1 receptor blocking agent LY2157299 during exposure to exosomes at 24 h and 48 h. Data are presented as means ± SEM; n = 3; * p ≤ 0.05, ** p ≤ 0.01.
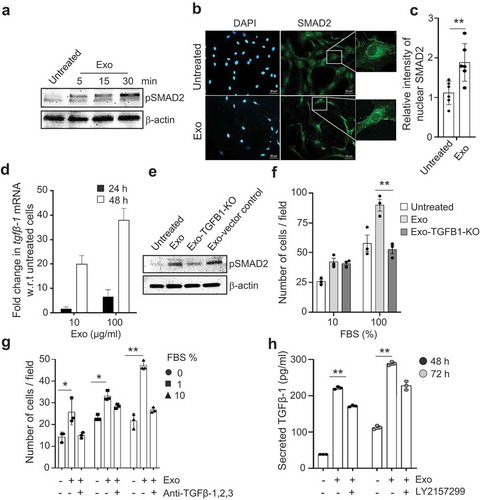
Figure 5. TGFβ-1 associated with exosomes has higher signalling stability compared with free TGFβ-1. (a) The signalling efficiency in MSCs, as determined by immunoblotting of pSMAD2, in response to dose-matched concentrations (10 pg/ml) of free TGFβ-1 or EV-associated TGFβ-1 estimated at 60 min. (b) The migration of MSCs towards free TGFβ-1 or EV-associated TGFβ-1 as a chemoattractant was performed by reverse migration assay. Data are presented as means ± SEM; n = 3; * p ≤ 0.05. (c) Outline of the procedure to enrich endosomes and lysosomes from cells using differential density centrifugation. Briefly, a total of 100 mg of cells was treated with biotinylated exosomes (100 μg/ml) for 60 min, after which the cells were lysed and centrifuged to remove cells and debris. Supernatants were top loaded on an iodixanol density gradient followed by a second round of iodixanol density gradient separation of the upper and lower fractions obtained from the first round of iodixanol density gradient. The final fractions for the endosome-enriched fraction (EEF) and the lysosome-enriched fraction (LEF) were collected for subsequent experiments. (d) Biotinylated EVs were incubated with HEK293T cells for 60 min, and organelles were isolated with an iodixanol gradient as described in outline and probed to detect LAMP1, EEA1, and biotinylated-exosome distribution. (e) Organelles isolated with iodixanol gradient from HEK293T treated with biotinylated exosomes followed by LAMP1 or EEA1 antibody-based capture and probed for biotinylated exosome-proteins. (F) The presence of biotinylated exosomes proteins at 60 min was confirmed in the organelle-enriched suspension of MSCs cells that were bound to LAMP1 or EEA1 antibody-coated beads.
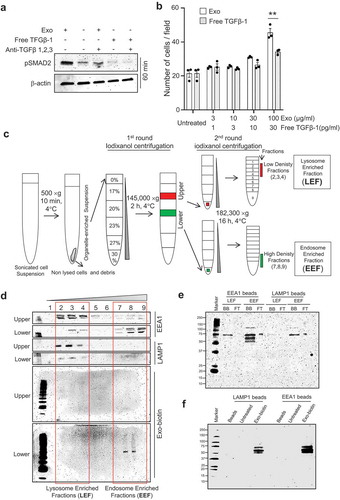
Figure 6. Inactive TGFβ-1 associates with mast cell-derived exosomes and uptake by an endocytic compartment of human mesenchymal stem cells. (a) In-vitro interaction of latent-associated peptide (LAP) and the active-TGFβ-1 complex was visualized using silver staining of native-PAGE gels. (b) Determination of in-vitro interactions between EVs and histidine-tagged LAP-TGFβ-1 complex with immunoblot detection of histidine and flotillin-1 on the complex that was floated on an iodixanol density gradient (10–24%). (c) Immunofluorescence detection of LAP-TGFβ-1-His with anti-histidine-AF488 antibody and endosomes (EEA1-RFP) in MSCs with or without exosomes. (d) Measure of TGFβ-1 in exosomes pellet that was treated with various pH conditions. (e) Detection of pSMAD2 using immunoblotting in MSCs that were exposed to EVs (50 μg/ml). MSCs were pre-treated with an inhibitor of endo-lysosomal acidification (chloroquine, CQ).
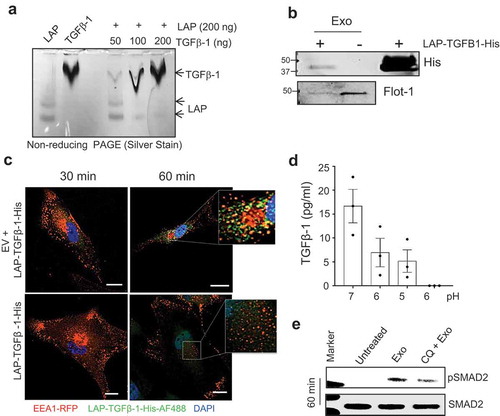
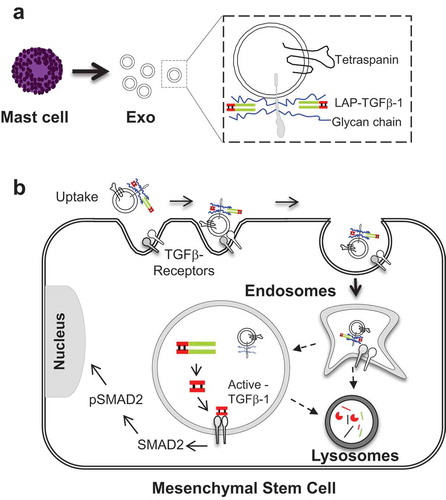
Figure 7. Graphical outline of the proposed mechanism. (a) TGFβ-1 and exosomes interaction and, (b) proposed mechanism of signalling in the endocytic compartment of MSCs induced by exosome-associated TGFβ-1.