Figures & data
Table 1. Relative expression of miR-939 in the whole blood of CRPS patients (n = 37) and healthy controls (n = 18) [Citation26] and serum-derived sEVs (n = 6 for both CRPS patients and controls) [Citation28].
Figure 1. Characterization of THP-1 derived sEVs. (a). Transmission electron micrograph of THP-1 derived sEVs obtained from the culture supernatant of 60 million cells. (b). Magnified image of the selected region in 1a. (c). Nanoparticle tracking analysis of sEVs indicated particles with a mean diameter of 103.2 ± 4.9 nm and a particle concentration of 1.3 × 10¹¹ ± 2.09 × 10⁹ particles/ml. (d). Transmission electron micrograph of sEVs double-immunostained for CD81 and CD9 (conjugated to 6nm and 10 nm gold particles, respectively). (e). Magnified image of the selected region in 1d. Western blotting of sEV pellet was performed to confirm the presence of exosome marker protein, Alix (f), CD81 (g), and TSG101 (h). Absence of the routine contaminants of EV preparations like GM130 (Golgi marker) and serum albumin was also ascertained in the isolated sEVs from both THP-1 cell-derived sEVs and PBMC-derived sEVs (i, j, respectively).
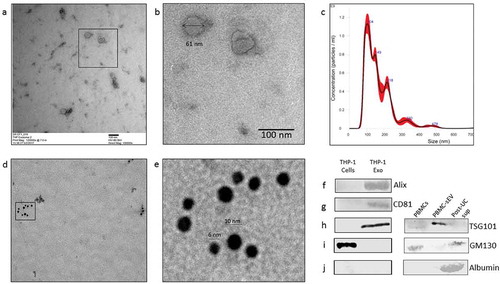
Figure 2. Regulation of miR-939 levels under inflammation. THP-1 cells were treated for 4 h with an inflammatory stimulus (LPS) following a two-hour pretreatment with an inhibitor for exosome biogenesis (GW4869). Cellular RNA was isolated and Taqman-based qRT-PCR used to determine the relative expression of miR-939 (a) and IL-6 (b) normalized to U6 snRNA and GAPDH, respectively. Significance was determined by one-way ANOVA with Sidak’s multiple comparison test *, # p < 0.05, ## p < 0.01. RNA was isolated from corresponding sEVs and Taqman-based qRT-PCR used to determine miR-939 expression normalized to miR-223. Significance was determined by Student unpaired t-test *** p < 0.001.
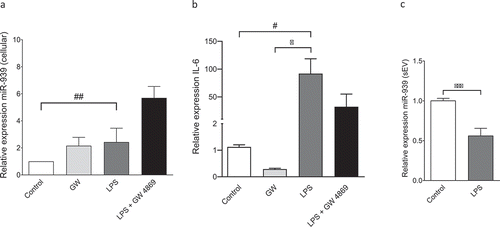
Figure 3. MCP-1/CCL2 induces miR-939 upregulation and sEV packaging of miR-939. THP-1 cells were treated for 4 h with MCP-1 following a two-hour pretreatment with a CCR2 antagonist. RNA was isolated from the cells and corresponding sEVs secreted in the supernatant. Taqman-based qRT-PCR was used to determine the relative expression of miR-939 in cells (a) and sEVs (b) normalized to U6snRNA and miR-223, respectively. Significance was determined by one-way ANOVA with Tukey’s multiple comparisons test %% p < 0.01, *** p < 0.001, ****, ####, %%%% p < 0.0001.
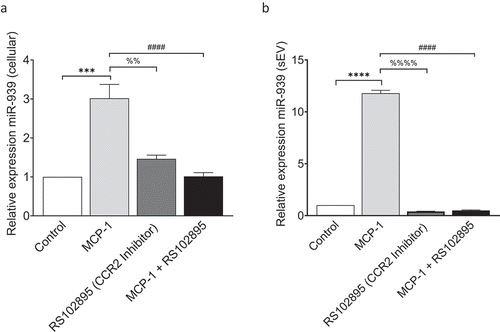
Figure 4. Overexpression of miR-939 drives its packaging into sEVs via cellular machinery. miR-939 harbours the EXOmotif which aids in exosomal packaging of miRNAs (a). THP-1 cells were transfected with miR-939 mimics using lipofectamine and the sEVs were isolated from the supernatant after 24 h. Taqman-based qRT-PCR was used to determine the relative expression of sEV miR-939 normalized to miR-223 (b). Taqman analysis of recipient HUVEC cells incubated with THP-1 cell-derived sEVs overexpressing miR-939 for 24 h shows a decrease in miR-939 targets following uptake (c). Significance was determined by student t-test for miR-939 or two-way ANOVA with Tukey’s multiple comparisons test for the target mRNAs ** p < 0.01, ****/#### p < 0.0001.
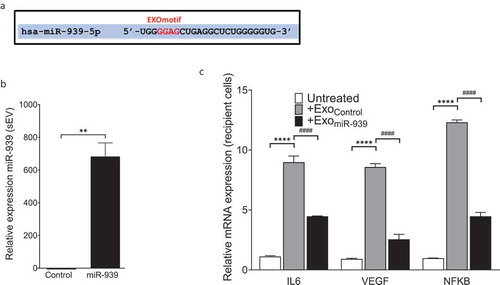
Figure 5. EXOmotifs determine the packaging of miR-939 into sEVs upon overexpression. (a). Presence of an EXOmotif towards the 5ʹ terminus of miR-939 could aid its exosomal recruitment via binding to RNA-binding proteins. This EXOmotif was mutated to a cytoplasmic localizing sequence (CL motif) in the EXOmut-939 mimic. (a). THP-1 cells were transfected with miR-939 or EXOmut-939 mimics using lipofectamine RNAiMAX and the sEVs isolated from the supernatant after 24 h. Taqman-based qRT-PCR was used to determine the relative expression of sEV mimics normalized to miR-223 (b). Significance was determined by two-way ANOVA with Sidak’s multiple comparison test ****, #### p < 0.0001. Fold downregulation of the miR-939 and EXOmut-939 mimics secreted from the transfected cells following inhibition of exosome secretion was also determined (c) and significance was determined by two-tailed unpaired Student t-test *p < 0.05.
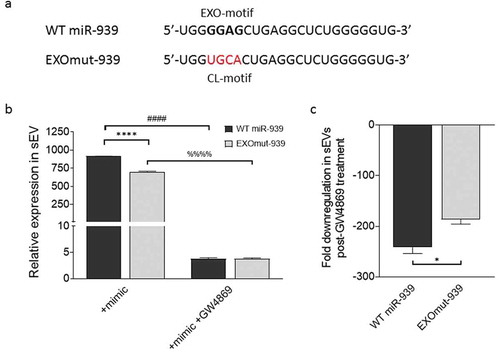
Figure 6. Electroporation efficiently packages miRNA within THP-1 cell-derived sEVs. (a). Ten micrograms of THP-1 cell-derived sEVs were electroporated with 30 picomoles of miR-939 at different voltages and the amount of miR-939 incorporated within sEVs was estimated by Taqman-based qRT-PCR. (b). The sEVs subjected to passive incubation or 2 kV electroporation with miR-939 were subsequently treated with a combination of RNase A and detergents to evaluate the surface versus internal incorporation of miRNA. miR-939 within electroporated sEVs were resistant to RNase A digestion, while miR-939 incubated passively with sEVs were significantly degraded. Taqman-based qRT-PCR was used to determine the miR-939 content (normalized to miR-223) and significance was determined by one-way ANOVA with Sidak’s multiple comparison test ***, ### p < 0.001, ****, #### p < 0.0001.
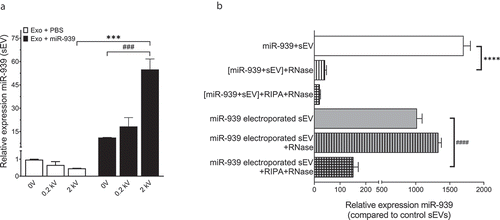
Figure 7. Cellular uptake of miR-939 electroporated sEVs. sEVs electroporated with miR-939 were double-labelled with Exo-red (RNA binding red fluorescent dye) and PKH67 (membrane labelling green fluorescent dye). Labelled sEVs were incubated with recipient HUVEC cells and the nucleus was live-stained with Hoechst 33342. Cells were observed by CLSM under an Olympus FV1000 microscope (63 X magnification) after 1 h and 24 h of incubation with sEVs (b). RNA colocalizes with sEV membrane at 1 h (solid yellow arrows), however at 24 h post-incubation, much of the RNA has been delivered into the cell, and the sEV membrane is probably incorporated into the plasma membrane (solid white arrows). Taqman-based qRT-PCR was used to determine the cellular miR-939 content (normalized to U6snRNA) in recipient cells following uptake (c). Significance was determined by two-way ANOVA with tukey’s multiple comparisons test ** p < 0.01, ****, #### p < 0.0001.
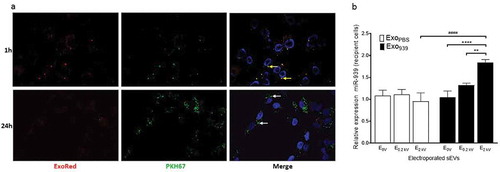
Figure 8. Clustering of inflammatory gene expression levels in THP-1 recipient cells incubated with different types of sEVs. A clustergram of the expression levels for differentially regulated inflammatory genes. Each column represents a particular type of sEV incubated with recipient THP-1 cells. T: no sEVs, TU: untreated sEVs, T9: miR-939 treated sEVs, TIN: anti-miR-939 treated sEVs. The heat map represents normalized gene expression values, with the colour indicating multiples of the standard deviation above or below the average value for that row in the heat map. Red, high; black, average; green, low.
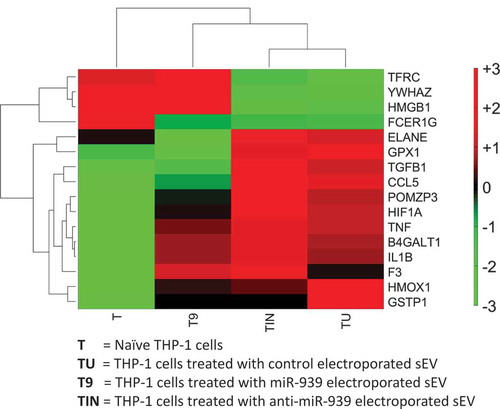
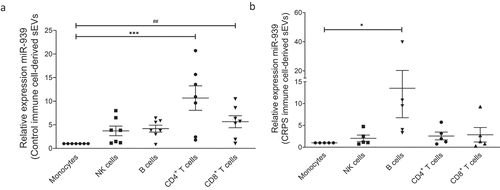
Figure 9. Ex vivo expression of miR-939 in control and CRPS patient immune cell-derived sEVs. Freshly isolated PBMCs from healthy donors (n = 7) or CRPS patients (n = 6) were separated using magnetic bead-conjugated antibodies (MACS) to immune cell sub-populations, namely monocytes, NK cells, B cells, CD4 and CD8 positive T cell populations. The immune cells were incubated separately in exosome-depleted medium and the sEVs were isolated from the supernatant after 24 h. Taqman-based qRT-PCR was used to determine the relative expression of sEV miR-939 normalized to miR-223 in controls (a) and CRPS patients (b). Significance was determined by one-way ANOVA with Dunnett’s test *, # p < 0.05, *** p < 0.001.