Figures & data
Figure 1. Floatation on iodixanol gradients separates sEVs with distinct RNA and DNA profiles.
(a) Density gradient fractionation of HMC-1 and TF-1 small EVs (sEVs). Nine fractions of 1 mL each were collected from top to bottom from iodixanol density gradients and washed in 38-94 mL of PBS by ultracentrifugation. Their densities were analysed by measuring the absorbance at 340 nm ranging from 1.111 to 1.278 g/mL for HMC-1 (F1–F9) and from 1.103 to 1.284 g/mL for TF-1 (F1–F9). Data are plotted as the mean of three independent experiments ± SEM. F1–F3 were considered as low-density (LD) fractions and F4–F7 as high-density (HD) fractions. (b) Representative illustration of nucleic acids, including RNA species (blue) and DNA species (orange), associated with the inside and outside of the sEVs. (c–d) Percentage of DNA (orange) and RNA (blue) in the HMC-1 and TF-1 gradient fractions. DNA and RNA concentrations were quantified with High-Sensitivity DNA and DNA 7500 chips and RNA 6000 Nano and Pico total RNA kits. Bars represent the mean + SEM of three independent experiments for DNA and two independent experiments for RNA. (e) Representative RNA Bioanalyzer profiles (blue) of HMC-1 and TF-1 F1–F7 from Pico total RNA chips. (f) Representative DNA Bioanalyzer profiles (orange) from HMC-1 and TF-1 F1–F7 run in High-Sensitivity DNA chips. The y-axis of the electropherograms represents fluorescent units (FU) and the x-axis represents the nucleotide length (nt). Please note that the y-axes have different scales. (g-h) Bar graphs representing the total amount (ng) of DNA (orange) and RNA (blue) in LD and HD fractions from HMC-1 and TF-1 density gradients. Bars show the mean + SEM of three independent experiments for DNA and two independent experiments for RNA.
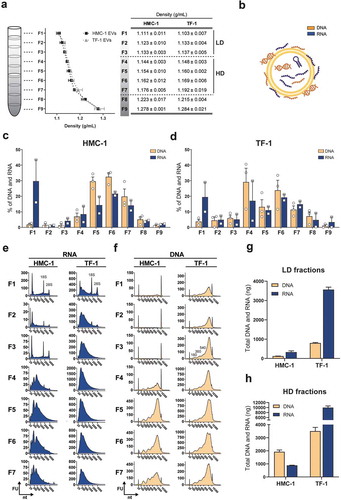
Figure 2. Proteomics analysis of DNA-binding proteins in LD and HD fractions.
(a) Percentage of DNA-binding proteins from the total number of proteins identified in the analysis of LD (yellow) and HD (blue) HMC-1 floated fractions. (b) Venn diagram showing the number of unique and common DNA-binding proteins identified in LD and HD HMC-1 fractions. (c) Table displaying the Histone proteins identified in the LD and HD fractions. UniProt accession numbers and complete histone names are shown. (d) After density flotation and fractionation of HMC-1 and TF-1 small EVs in high-resolution iodixanol gradients, equal volume (9 µL) of each fraction (F1–F9) and 10 µg of total whole-cell lysates were loaded on SDS-PAGE gels. Membranes were blotted with Histone H2A and Histone H3 antibodies.
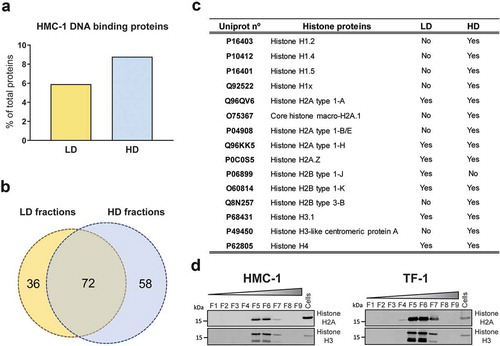
Figure 3. Characterization of sEVs in LD and HD fractions.
(a) After density flotation and fractionation of HMC-1 and TF-1 sEVs in high-resolution iodixanol gradients, equal volume (15 µL) of each fraction (F1–F9) and 10 µg of total whole-cell lysates were loaded on SDS-PAGE gels. Membranes were blotted with the following antibodies: Alix (~100 kDa), Flotillin-1 (~48 kDa), TSG101 (~47 kDa), CD63 (~30–60 kDa), CD81 (~22 kDa), CD9 (~20 kDa), β-Actin (~42 kDa) and Calnexin (~90 kDa). (b) Nanoparticle Tracking Analysis of the total number of particles per fraction from the HMC-1 and TF-1 gradients (ZetaView). Bars represent the mean ± SEM of two independent experiments run in triplicate. (c) Representative negative staining electron transmission microscopy images of HMC-1 and TF-1 high-resolution density fractions (F1, F2, F5, F6). Five microliters were loaded to the grids per each fraction. Scale bars = 200 nm.
Figure 4. Most of the vesicle-associated DNA is not protected against DNase treatment and thus is localised on the vesicle surface.
Each collected gradient fraction was divided into two. One half was DNase treated (grey) while the other half served as untreated control (black). (a-b) The DNA concentration before and after Turbo DNase I digestion of HMC-1 fractions and TF-1 fractions was determined by capillary electrophoresis using high-sensitivity DNA bioanalyzer chips. (c-d) Representative capillary electrophoretic gels of HMC-1 and TF-1 fractions (F1–F9) prior to DNase addition (represented as −) and after DNase treatment (represented as +). (e-f) Pie charts representing the percentage of total DNA of LD and HD HMC-1 and TF-1 density fractions before (−DNase, black) and after DNase treatment (+DNase, grey).
Figure 5. sEVs are intact after DNase treatment.
The resulting 1 mL fractions from the HMC-1 and TF-1 high-resolution iodixanol density fractionation were pooled based on low-density (LD) (F1–F3) or high-density (HD) F4–F7, washed with PBS, and re-pelleted by ultracentrifugation at 118,500 × gavg for 3.5 h. sEV samples were divided into two aliquots, one of which was DNase-treated (+DNase), and the other was kept untreated and used as a control (Ctrl). (a) Representative electron microscopy images of +DNase and Ctrl sEVs are shown. Three micrograms of the sample were loaded per each grid. Scale bars are 500 nm in the full pictures and 100 nm in the magnifications. (b) The DNase-treated and non-treated sEVs were bound to anti-CD63 beads, labelled with anti-CD63-Phycoerythrin (PE), and evaluated using flow cytometry. Histograms of non-treated (NT) sEVsCD63+ (blue), DNase-treated (+DNase) sEVs CD63+ (red), and isotype control (grey) are shown. Count (y-axis) vs. PE signal (x-axis) is shown. (c) HMC-1 cells were treated with 10 µM 5-Bromo-2´-Deoxyuridine (BrdU) to label newly synthesized DNA. Next, cell-conditioned media from the BrdU-treated cells was collected and used to isolate sEVs using differential centrifugation followed by density fractionations as described in material and methods. Next, LD and HD fractions were run in an in-house generated enzyme-linked immunosorbent assay (ELISA). The schematic representation of the sandwich ELISA system designed to measure and capture BrdU+/CD9+ sEV is shown. LD and HD samples were NT or DNase+, and the graph represents the mean ± SEM of three independent experiments per group. (d) Direct ELISA-based detection of CD9+ signal on pre-captured DNase+ sEV. The graph represents the mean ± SEM of three independent experiments per group. HRP = horseradish peroxidase, RLU = relative luminescence units.
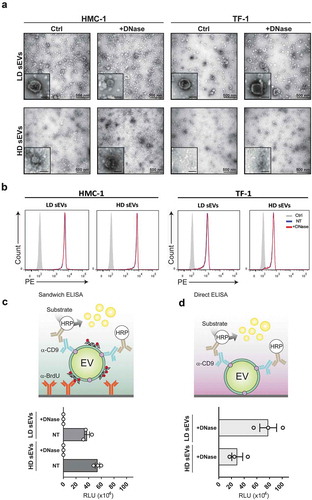
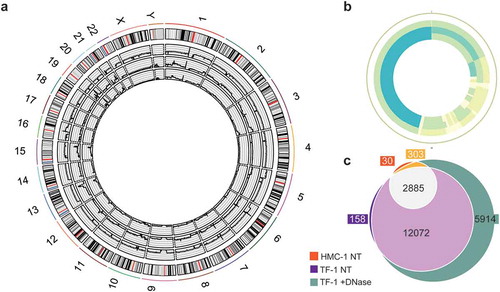
Figure 6. Whole-genome coverage on the sEV-associated DNA.
F1–F7 from HMC-1 and TF-1 gradients were pooled, pelleted, and divided into two aliquots, one that was DNase-treated (protected DNA) and one that was left untreated (total DNA) prior to DNA isolation. Next, total DNA from TF-1 fractions, HMC-1 fractions, and DNase-treated TF-1 fractions was analysed by WGS. (a) Circos plot presenting the 46 chromosomes of the three sequenced DNA samples: HMC-1 non-treated (edge sample), TF-1 non-treated (middle sample), and TF-1 DNase treated (inner circle sample). (b) Circos plot representing the mitochondrial chromosome: HMC-1 non-treated (edge sample), TF-1 non-treated (middle sample), and TF-1 DNase treated (inner circle sample). Coverage colouring from low to high (max four parts per million) – white (lowest), light green, light blue, dark blue (highest). (c) Venn diagram comparing the genes in the three samples with coverage of more than 50 reads: orange (HMC-1 non-treated, NT), purple (TF-1 NT), and green (TF-1 +DNase-treated).