Figures & data
Figure 1. Single molecule – single vesicle characterization of CD63-GFP-tagged extracellular vesicles.
(a) Direct sucrose gradient fractionation of conditioned medium from CD63-GFP transfected HEK293T cells without prior ultracentrifugation. X-axis: measured sucrose concentrations in collected fractions. GFP fluorescent particles of ca 50–120 nm diameter (measured by FCS) co-fractionate with the EV marker Alix, peaking at ca 32–36% sucrose. (b) Following UF on a 100 kDa MWCO membrane, enriched medium was loaded onto a Superdex200 column for size exclusion chromatography, with continuous UV detection (blue line). The total GFP fluorescence count rate was measured in each of the 60 fractions by FCS (upper panel, green line). Western blots for different exosomal markers were performed after pooling of 4 fractions each into samples A-L as indicated, omitting one fraction in between pools. CD63-GFP fusion protein bands (multiple glycosylated isoforms) versus truncated GFP bands detected on an anti-GFP western blot are indicated by arrows and asterisks, respectively. (c) Cryo-EM analysis of UF-SEC isolated CD63-GFP versus native EVs (representative images). Scaling bar: 100 nm. (d) Left panel, LC-MS proteomics of native versus CD63-GFP HEK293T EVs. Spectral counts for a subset of proteins from the list in Table S1 are shown. Right panel, Venn diagram comparing the top 500 proteins, ranked by total spectral count (left), or all proteins detected at a < 1% false discovery rate (FDR) (right). (e) Individual fractions from size exclusion chromatography of HEK293T CD63-GFP EVs in ) were analysed by FCS with (red data points) and without (blue data points) vesicle disruption by the detergent NP40s. The translational diffusion time (τdiff, upper panel left y-axis and conversion into hydrodynamic diameter, right y-axis), molecular brightness (CPP, second panel) as well as absolute number of fluorescent molecules within the confocal volume (N, third panel) are depicted across the fractions. The ratio of freely diffusing GFP fluorescent particles before and after NP40s treatment (third panel) yields the average number of CD63-GFP molecules per particle (bottom panel). Frames indicate fractions comprising the two main fluorescent populations: the first indicates a heterogenous population comprising mostly GFP-tagged EVs, whereas the second one consists of monomeric GFP. (f) Disruption of EVs (stored at −80°C) with different mechanical and biochemical treatments based on the fraction of intact vesicles versus free GFP measured by FCS. (g) Time course of CD63-GFP vesicle release. The concentration of CD63-GFP positive vesicles in UF enriched samples from HEK293T cells was determined by FCS, the total number of vesicles between 70 and 140 nm in size was determined by NTA. Time points represent hours of conditioning, starting 5 h after transfection.
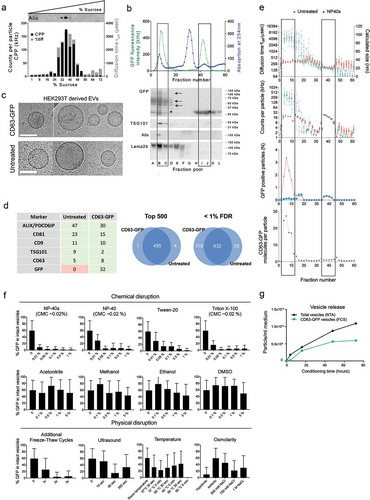
Figure 2. Overexpression of different GFP-tagged EV-markers in HEK293T parental cells.
(a) LC-MS/MS proteomic analysis of HEK293T-EVs. The overall protein rank (X-axis) is plotted against the protein area expressed in base-10 log scale (Y-axis). Proteins which have been selected for the screening are marked in green. (b) Schematic representation of EV biogenesis with a zoomed-in vesicle depicting the proteins selected as loading moieties and their theoretical vesicular localization. (c) Western blot on HEK293T cells illustrating the molecular weight (kDa) of each GFP-fused protein (upper panels) and the expression of several EV markers across the samples (lower panels). β-actin was used as loading control.
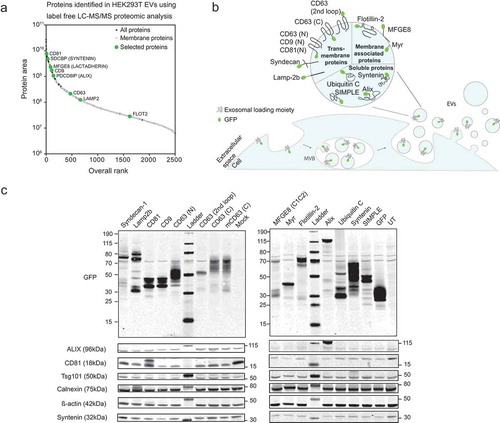
Figure 3. Loading of different GFP-tagged EV markers into UF-qEV purified EVs. (a) Western blot of HEK293T-derived EVs illustrating the molecular weight (kDa) of each GFP-fusion protein (upper panels) and the expression of several EV markers across the samples (lower panels). (b) NTA analysis of isolated EVs showing the total particle concentration (black) and the concentration of GFP positive particles (green) in each sample (N = 3). (c) Table representing the percentage of GFP positive vesicles over total particle count (N = 3). (d) Single vesicle imaging using confocal fluorescence microscopy after spotting EVs onto coverslips (scale bar in the left-bottom corner is 20 µm, all overview images are shown to scale). Individually contrast-enhanced zooms are shown for illustration in the right-bottom corner (scale bar in the upper-right corner is 5 µm).
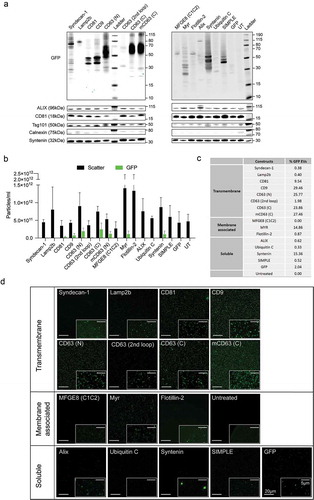
Figure 4. Fluorescence correlation spectroscopy of different GFP-tagged EVs. UF-qEV isolated vesicles, carrying different EV proteins fused to GFP were analysed by FCS without (red data points) and with vesicular disruption by NP40s (blue data points). (a) The diffusion time τ (µs), (b) the molecular brightness CPP (kHz) and (c) the number of particles is shown for each GFP-tagged EV protein. (d) The percentage of freely diffusing GFP fluorescent particles was calculated based on a 2-component FCS analysis using the τdiff of free versus vesicular GFP. (e) Schematic overview of the vesicular disruption by NP40s treatment and the relative observed parameters. (f) Average number of GFP molecules per vesicle based on increase in particle numbers and decrease in molecular brightness upon vesicle disruption by NP40s. Bar graphs indicate representative biological replicates (individual biological replicates are shown in Supplementary Figure 8(b)). Error bars represent standard deviations from at least four technical replicates.
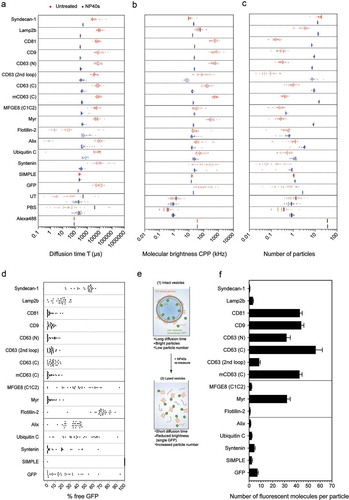
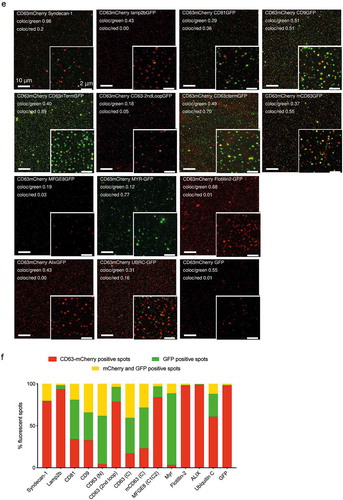
Figure 5. Single vesicle quantification of GFP-tagged reporters in CD63 positive vesicles.
(a) HEK293T cells were transfected with either CD63-GFP or CD63-mCherry, conditioned media were mixed and EVs were co-isolated by different protocols to assess single vesicle integrity, aggregation or fusion. CD63-GFP-mCherry transfected cells were used as control. (b) 1 µl of EV sample was spotted onto glass slides, covered with 0.17 mm coverslips to generate a thin EV layer, and imaged by high NA confocal or widefield fluorescence imaging. (c) EVs from co-isolated media were detected as light diffraction-limited spots in either green or red channels with negligible occurrence of double-positive vesicles, confirming detection and integrity of single vesicles after UF-SEC (left panel). UC isolation resulted in a small fraction of double-positive vesicles (middle panel). Double labelled control EVs are shown in the right panel. The isolated EVs were analysed by confocal microscopy and the colocalization was quantified based on overlap of the point spread functions in the two fluorescent channels to derive the number of GFP (green, line pattern), mCherry (red) and GFP/mCherry (yellow) double positive vesicles. (d) CD63-GFP/mCherry double labelled control EVs imaged by high NA widefield fluorescence imaging, confirming a high degree of co-localization. The EV point spread function (PSF, bottom left) in comparison to the PSF of 100 nm Tetraspec beads (bottom right) confirms detection as light diffraction-limited spots. (e) Co-localization of different GFP-tagged EV proteins with CD63-mCherry EVs by single vesicle widefield imaging. Images are shown after deconvolution and as maximum intensity projections (MIPs from 5 µm z-stacks; red: CD63-mCherry; green: GFP. scale bar 2 µm). Co-localization quantification as indicated in the image. (f) Percentage of CD63-mCherry (red), GFP (green) and double-positive EVs (yellow) for the different GFP constructs (technical replicates shown as individual bars).
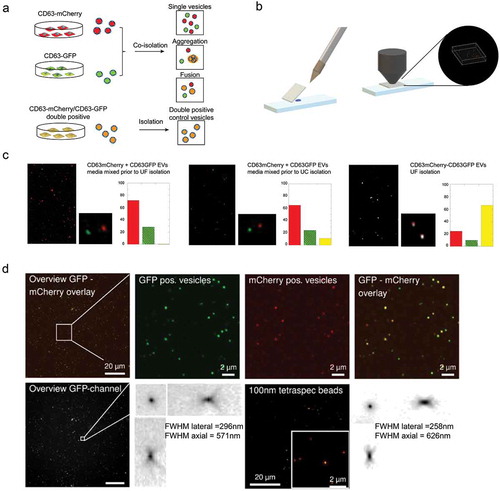
Table 1. Summary of tested EV sorting domains and proteins.
Figure 5. (Continued).