Figures & data
Table 1. Clinicopathological characteristics of samples in the training and validation sets.
Figure 1. Representative imaging and pathological information in different groups. Abbreviations: AIS, adenocarcinoma in situ; MIA, minimally invasive adenocarcinoma; IA, invasive adenocarcinoma; SP, sclerosing pneumocytoma.
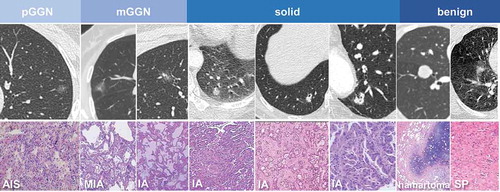
Figure 2. Characteristic proteins and morphology of extracellular vesicles (EVs). (a) The protein levels of Alix, TSG101, syntenin, CD9, and Calnexin in the EVs of seven representative samples were assessed using western blotting. (b) Nanoparticle tracking analysis results from representative EVs samples are shown. (c) Images of EVs from two representative samples were taken by scanning electron microscopic analysis. The representative EVs morphology is highlighted by a red box.
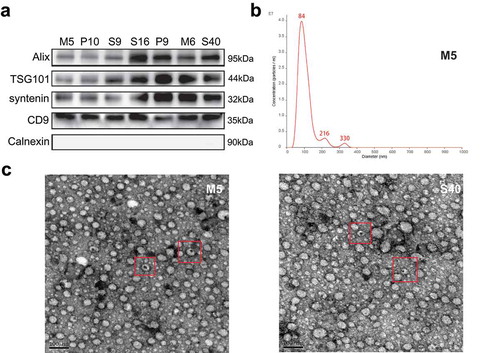
Table 2. Separate sensitivity and specificity of SVM models in the training and validation sets in the order of sum area under the curve (AUC; top 10).
Figure 3. Visualized distribution of several support vector machine (SVM) classifiers with different interests. (a) The SVM model with the highest diagnostic value. (b) The SVM model with the highest sensitivity. (c) The SVM model with the highest specificity. Malignant nodule: orange; benign nodule: blue.
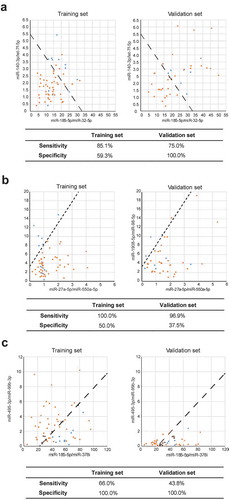
Figure 4. Principal component analysis (PCA). (a) PCA of pure ground-glass nodule (pGGN) samples and solid samples. (b) PCA of all malignant nodules, including pGGNs, mixed ground-glass nodules (mGGNs), and solid samples.
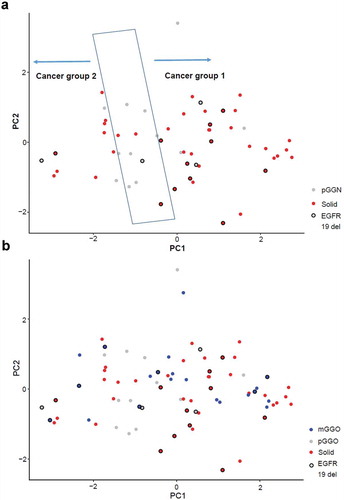
Figure 5. Biological analysis of the stratification of malignant nodules. (a) Differentially expressed miRNAs between solid groups 1 and 2 according to PCA (with absolute weights larger than 0.05 were selected). (b) Pathway enrichment analysis of the differentially expressed miRNAs between solid groups 1 and 2. (c) Differences in the expression levels of miR-500a-3p, miR-501-3p, and miR-502-3p between groups 1 and 2. (d) Survival curves of samples with different expression levels of miR-500a-3p, miR-501-3p, and miR-502-3p using data from TCGA database (top 15% versus bottom 15%).
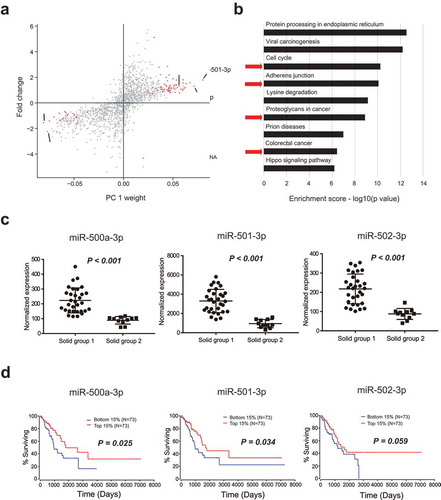
Table 3. Significant differential expression of miRNAs before and after surgery.
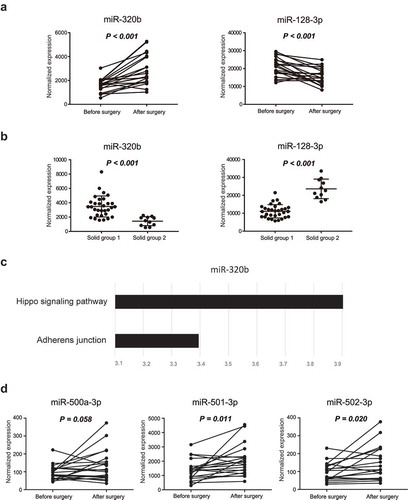
Figure 6. Biological analysis of exosomal miRNAs between pre- and postsurgical plasma samples. (a) Expression levels of miR-320b and miR-128-3p before and after surgery. (b) Differences in the expression levels of miR-320b and miR-128-3p between group 1 and group 2. (c) The targets of miR-320b were enriched in the Hippo signaling pathway and adherens junctions. (d) Expression levels of miR-500a-3p, miR-501-3p, and miR-502-3p before and after surgery. Differentially expressed miRNAs between the before and after surgery groups were analyzed using pairwise t tests, whereas differentially expressed miRNAs between solid group 1 and 2 were calculated by Mann-Whitney tests. Results with p values of less than or equal to 0.05 were considered statistically significant.