Figures & data
Figure 1. HA fragments decomposed by Exo-PH20 induced DC maturation. (a) Characterization of HA fragments generated by Exo-PH20. Top: Size determination of HA (> 10 kDa) by agarose gel electrophoresis. Bottom: FACE analysis of HA fragment from the centrifugation filtrate (< 10 kDa). Oligo-HA of defined sizes (4–12 disaccharides) were used as standards. (b) Flow cytometric analysis of the phenotypic maturation of DCs in vitro. BMDCs incubated with HMW-HA or Exo-PH20-decomposed HA fragments (< 10 kDa) for 24 h were stained with specific monoclonal antibodies against CD11c, CD40, CD86 and CCR7 and analysed by flow cytometry. The data represents the percentage (%) of CD40, CD86, CCR7 expression on BMDC. Each value represents the mean ± SD (*p < 0.05, ** p < 0.01, ***p < 0.001 versus the BMDC-only group as assessed by one-way ANOVA with Tukey’s post test). (c) Western blot analysis of the TLR-4 mediated-DC maturation pathway. BMDCs were incubated with HMW-HA or Exo-PH20-decomposed HA fragments (< 10 kDa) for 6 h. The contents of phospho-p38, phospho-p44/42, total p38, total p44/42 and GAPDH were detected in cell lysates and the NF-ĸB content was detected in nuclear extracts.
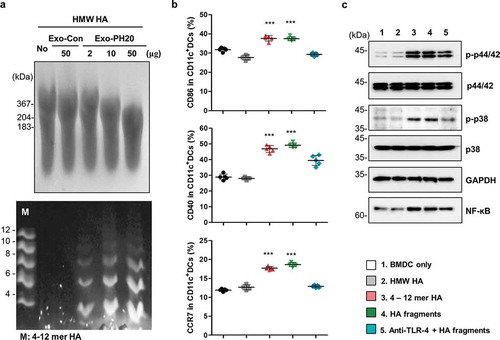
Figure 2. Exo-PH20 induces anti-tumour immunity in the B16F10-Ova melanoma model. (a) Anti-tumour effect of Exo-PH20 in B16F10-Ova tumour-bearing C57BL/6 mice. Mice were injected (i.t.) with 50 μg Exo-Con or Exo-PH20 (black arrows). Each value represents the mean ± SD (n = 8 mice per group). (b) B16F10-Ova tumour-bearing mice were injected (i.t.) with 50 μg small EVs (black arrows) and further treated (i.p.) with 200 μg/kg of anti-TLR-4 on days 0, 8, 11 and 14. Each value represents the mean ± SD (n = 4 mice per group). (c – e) At day 18, TDLNs were extracted from mice of all groups and analysed by flow cytometry. (c) The percentage (%) of CD40, CD86, CD80 and CCR7 expression on CD11c+ DCs in TDLNs. Each value represents the mean ± SD (n = 5). (d) The number of CD103+ DCs in TDLNs, which was calculated as the % of CD103+CD11c+ DCs identified from among 106 TDLN cells. Each value represents the mean ± SD (n = 5). (e) The percentage (%) of H2Kb-Ova expression on CD11c+ DCs (Left) and CD103+CD11c+ DCs (Right) in TDLNs. The percentage (%) was determined with respect to the IgG. Each value represents the mean ± SD (n = 5). (f) B16F10-Ova tumour-bearing Batf3−/- mice were treated (i.t.) with PBS, 50 μg Exo-Con or Exo-PH20 (black arrows). Each value represents the mean ± SD (n = 3 mice per group). *p < 0.05, **p < 0.01, ***p < 0.001, as assessed by one-way ANOVA with Tukey’s post test.
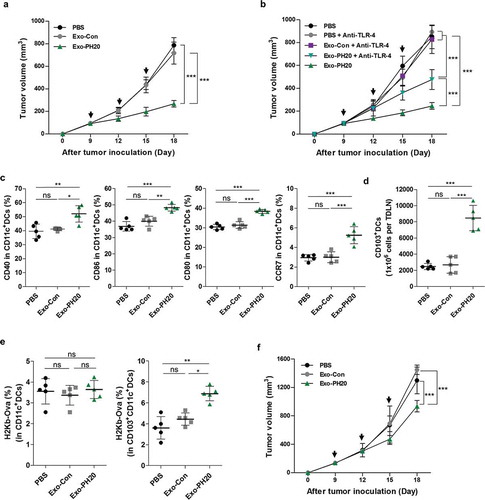
Figure 3. Exo-PH20 increases T cell cross-priming and CD8+ T cell infiltration. (a, c – f) Spleens, TDLNs and tumour tissues were harvested on day 18. (a) CD11c+ DCs were isolated from tumours or TDLNs and co-cultured ex vivo with OT-I naïve CD8+ T cells for 72 h. The amount of secreted IFN-γ in culture supernatants was analysed by ELISA. Each value represents the mean ± SD (n = 4). (b) At day 18, CFSE-labelled OT-I naïve CD8+ T cells were transferred (i.v.) into mice. After 72 h, TDLNs were harvested and the proliferation of OT-I CD8+ T cells was determined by flow cytometry. Left: Representative CFSE profiles of proliferating CD8+ T cells. Right: The percentages of gated proliferating CSFE+CD8+ T cells. Each value represents the mean ± SD (n = 4). (c) The accumulation of CD8+ T cells in B16F10-Ova tumour tissues. Left: Representative immunofluorescence images of the infiltration of CD8+ T cells into B16F10-Ova tumours. Tumour sections were stained with anti-mouse CD8 antibody (green) and nuclei were counterstained with DAPI (blue). Scale bar, 100 μm. Right: The number of tumour-infiltrating CD8+ T cells (per section at × 400 field of view) was counted in each group. Each value represents the mean ± SD (n = 10). (d) The percentages of CD8+ tumour-infiltrating lymphocytes in B16F10-Ova tumour tissues were analysed by flow cytometry. Each value represents the mean ± SD (n = 5). (e) The amount of IFN-γ in splenocyte culture supernatants was measured by ELISA. Each value represents the mean ± SD (n = 4). (f) The percentages of granzyme B in CD8+ T cells isolated from B16F10-Ova tumour tissues were analysed by flow cytometry. Each value represents the mean ± SD (n = 5). (g) Immune-deficient mice were transplanted with B16F10-Ova melanoma cells at day 0 and treated (i.t.) with PBS, 50 μg Exo-Con or Exo-PH20 (black arrows). Each value represents the mean ± SD (n = 4 mice per group). *p < 0.05, **p < 0.01, ***p < 0.001, as assessed by one-way ANOVA with Tukey’s post test.
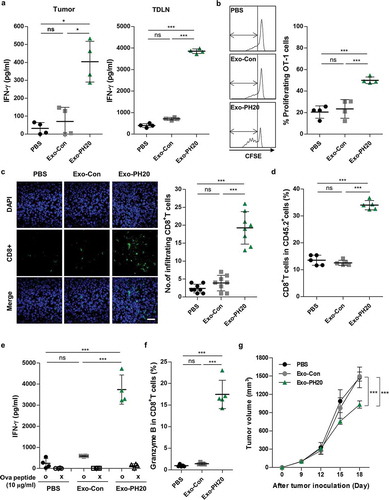
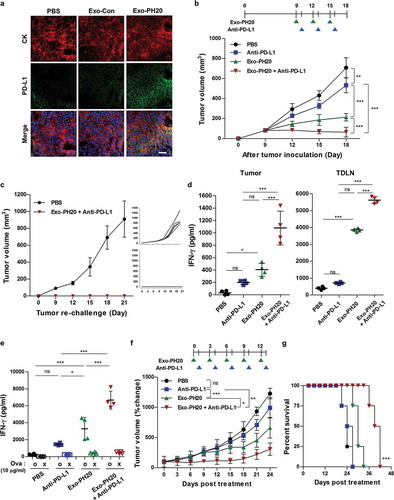
Figure 4. Anti-PD-L1 promotes anti-tumour immunity in the B16F10-Ova melanoma mouse model and the genetically engineered MMTV-PyMT mouse model. (a) Representative immunofluorescence images of PD-L1 expression in B16F10-Ova tumour sections. Each tumour section was stained with anti-mouse PD-L1 (green) and anti-mouse pan-cytokeratin (CK) (red). DAPI was used to counterstain nuclei (blue). Scale bar, 100 μm. (b) Mice were inoculated with 1 × 10⁶ B16F10-Ova melanoma cells and injected with 50 μg Exo-PH20 (i.t.) and/or 2 mg/kg anti-PD-L1 (i.p.) as indicated. Each value represents the mean ± SD (n = 6 or 8 mice per group). (c) Mice exhibiting complete tumour regression were re-challenged with 2 × 10⁶ B16F10-Ova cells on the opposite flank at day 28 after the initial tumour inoculation. Left: Each value represents the mean ± SD (n = 8 mice per group). Right: tumour volume growth curves of individual mice in each group. (d) CD11c+ DCs were isolated from tumours or TDLNs of B16F10-Ova tumour-bearing mice treated with Exo-PH20 and/or anti-PD-L1, and co-cultured ex vivo with OT-I naïve CD8+ T cells for 72 h. The amount of IFN-γ secreted from OT-I CD8+ T cells was analysed by ELISA. Each value represents the mean ± SD (n = 4). (e) The amount of IFN-γ in splenocyte culture supernatants was analysed by ELISA. Each value represents the mean ± SD (n = 4). (f – g) MMTV-PyMT mice were treated with 200 μg Exo-PH20 (i.v.) and/or 2 mg/kg anti-PD-L1 (i.p.) as indicated. (f) The change in tumour volume relative to that at the initiation of treatment in MMTV-PyMT mice. Each value represents the mean ± SD (n = 6 mice per group). (g) Kaplan-Meier survival curves of MMTV-PyMT mice subjected to co-treatment with Exo-PH20 and anti-PD-L1 (n = 6). *p < 0.05, **p < 0.01, ***p < 0.001, as assessed by one-way ANOVA with Tukey’s post test (a – f) and the log-rank test (g).