Figures & data
Table 1. Demographics and clinical characteristics of the study population.
Table 2. Mean Cq values for RT-qPCR reference genes and statistical testing for arteriovenous differences using two-tailed, paired student’s t-test.
Figure 1. Library sizes (dots) and mapped miRNA reads (squares) for arterial (red) and venous (blue) crude cell-free samples (a) and samples additionally purified by SEC (b). All data are absolute numbers of reads. Lines indicate mean per-group read counts.
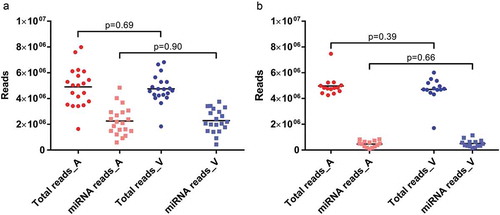
Figure 2. Mapping distribution for crude cell-free samples (a) and samples additionally purified by SEC (b). Statistics of reads mapped to major classes of non-coding RNAs. Read counts are visualised as relative frequencies of total library sizes. Mapping rates for miRNAs were 44.20 ± 9.96% (arterial crude samples), 46.39 ± 11.46% (venous crude samples), 9.51 ± 5.03% (arterial purified EVs) and 10.48 ± 4.55% (venous purified EVs).
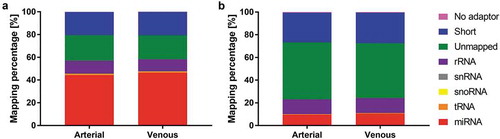
Figure 3. Correlation of arterial and venous miRNA expression in crude cell-free samples for all miRNAs (R2 = 0.9923, a) and miRNAs with a mean expression < 1E4 reads (R2 = 0.9948, b). Similarly, in samples purified by SEC, correlation of arterial and venous miRNA expression was extremely high for all miRNAs (R2 = 0.9992, c) and miRNAs with a mean expression < 1E4 reads (R2 = 0.9943, d). All data are mean DESeq2-normalised read counts for arterial and venous samples (n = 20 for crude and n = 14 for purified samples, respectively).
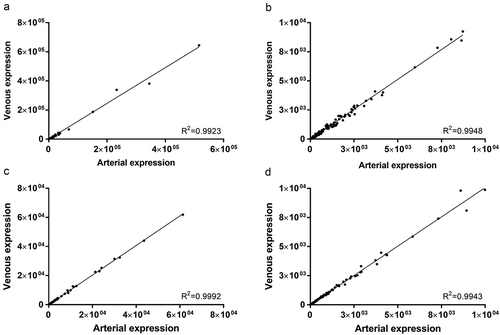
Figure 4. Unsupervised clustering of miRNA expression in crude (top panel) and SEC-purified (bottom panel) samples. Samples are colour-coded in red (arterial) and blue (venous). Patients are displayed by individual symbols. In principal component analysis, arterial and venous expression profiles of crude (a) and purified (c) samples displayed significant overlap. In hierarchical clustering, individual specimens in crude samples generally clustered by patient ID rather than sampling site (b), while purified EVs clustered by patient ID to a lower degree (d).
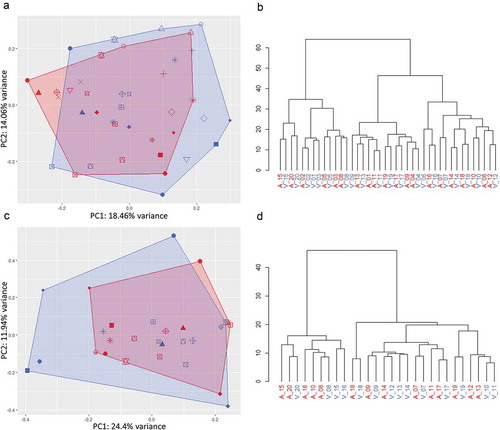
Figure 5. Variability of the top ten most abundant miRNAs within and across patients for crude cell-free samples (a) and additionally purified samples (b). Black bars: Mean intra-patient coefficient of variation (Cv) of arterial and venous samples. Red and blue bars: Mean Cv of all arterial and venous samples across patients, respectively.
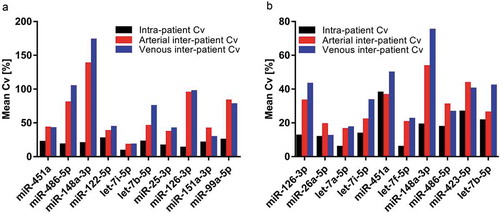
Figure 6. Significantly regulated miRNAs from NGS and validation by RT-qPCR. Illustration of four miRNAs differentially regulated between arterial and venous crude samples from NGS (a). Normalised read counts were plotted for each paired arterial and venous specimen. Individual changes in miRNA expression are indicated by lines. All miRNAs displayed a slight overall tendency of higher expression in arterial samples, albeit with reversed trends for some patients. padj: adjusted p-value; log2FC: log2 fold change. Illustration of normalised Cq values from the subsequent RT-qPCR validation (b). Only miR-493-5p showed significantly higher expression in arterial samples. Specimens which did not proper amplify during RT-qPCR were removed from the data set, and only matched arterial and venous samples were included for analyses. miR-223-3p, n = 19; miR-379-5p, n = 17; miR-493-5p, n = 15; miR-542-3p, n = 10; NS: not significant.
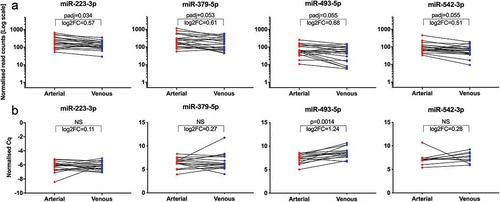
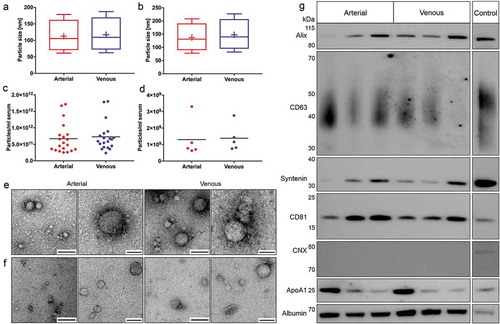
Figure 7. Biological characterisation of crude and purified EVs. Characterisation of particle size distributions by NTA in crude (n = 20, a) and purified samples (n = 5, b). Data are displayed as boxplots from the 10th to the 90th percentile, showing median (line) and mean (+) particle diameters. Median diameters of crude EVs from arterial and venous serum did not differ significantly (p = 0.056), while mean diameters of arterial particles were significantly smaller (p = 0.040). Particle diameters in additionally purified samples were also significantly smaller for arterial samples (median: p = 0.034, mean: p = 0.031). Depiction of particle concentrations/ml serum by NTA in crude (n = 20, c) and purified samples (n = 5, d). No significant changes in particle numbers could be detected for arterial and venous crude (p = 0.059) and purified EVs (p = 0.650). Lines indicate mean. Illustration of spherical EV-like extracellular particles with a size of about 100 nm by TEM for crude (e) and purified samples (f). Matched specimens from n = 3 individuals were imaged for both isolation protocols. Scale bar 1st and 3rd column: 250 nm; Scale bar 2nd and 4th column: 100 nm. Immunoblot profiling of SEC-purified samples (g). Arterial and venous samples were positive for EV-specific protein markers (alix, CD63, syntenin and CD81). CNX could not be detected in any of the samples. All samples were positive for non-EV-enriched proteins ApoA1 and serum albumin. Results are depicted for three paired arterial and venous biological replicates. HEK293 cell lysate was used as a positive control for alix, CD63, syntenin, CD81 and CNX. Recombinant ApoA1 and HepG2 cell lysate served as a positive control for ApoA1 and serum albumin, respectively.