Figures & data
Table 1. Sample size in each group, depending on the effect size (after normalization) and standard deviation, given a power of 80% and α equal to 0.001.
Table 2. Data on healthy individuals (HIs).
Figure 1. Experimental set-ups of variation. The total variation is represented by: (a) the instrumental variation (b) the total technical variation (c) the intrabiological variation and (d) the interbiological variation. The names of the samples are indicated.
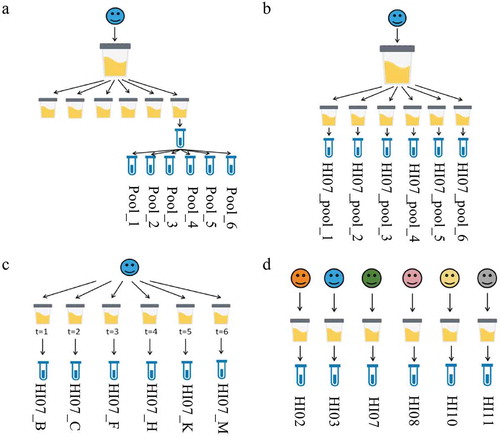
Figure 2. Number of master proteins per sample in each variation set-up. Samples Pool_1 until Pool_6 were used for the instrumental variation. The samples HI07_pool_1 until HI07_pool_6 were used to calculate the total technical variation. Samples HI07_B/_C/_F/_H/_K/_M were used to determine the intrabiological variation and HI02/HI03/HI07_M (further called HI07)/HI08/HI10/HI11 for the interbiological variation.
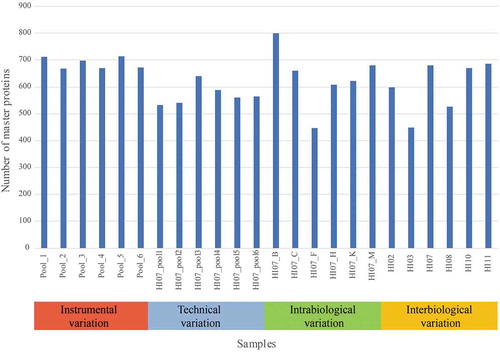
Figure 3. Percentage of unique peptides and lipids of the different variation set-ups in the function of the standard deviation (SD) of normalized log intensity. (a) 90% of the least variable peptides of the total variation set-up leads to an SD of 2. (b) The 90% least variable lipids of the total variation set-up do not have an SD that exceeds 1.2.
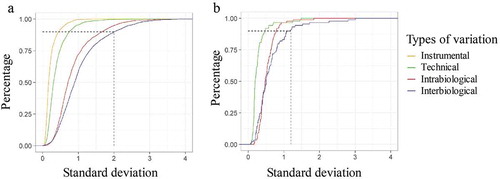
Figure 4. Boxplot of standard deviation (SD) of normalized log intensity of the different variation set-ups. (a) SD of the instrumental, technical, intrabiological and total variation is shown for the proteomic data. (b) SD of the technical, intrabiological and total variation is shown for the lipidomic data.
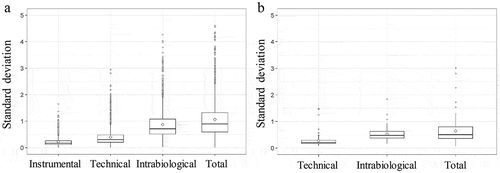
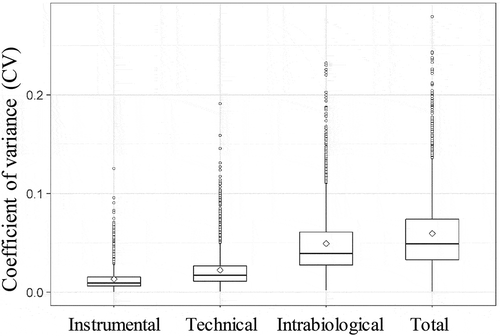
Figure 5. Boxplots of coefficients of variance (CVs) of the peptides in the different variation set-ups (instrumental, technical, intrabiological and total variation).