Figures & data
Figure 1. Serum extracellular vesicles isolated from healthy volunteers are a mixture of exosomes and other microvesicles.
(a) A representative transmission electron micrograph (TEM) of EVs from patient serum is shown (scale bar = 200nm), an inset shows a zoomed in view of particles (scale bar = 100 nm). (b) Dynamic light scattering of serum EVs shows that the average size of isolated particles to be around 200nm. (c) Flow cytometric analyses of beads incubated with EVs shows the detection of Annexin V, CD81 and ApoB with fluorochrome-labelled primary antibodies. Annexin V, CD81 and ApoB are shown in the histograms in blue while the isotype controls are depicted in red. (d) Dot Blot showing the expression of Alix and ApoB in EV’s isolated from Serum using the ExoEasy protocol. Serum was blotted as a positive control for ApoB.
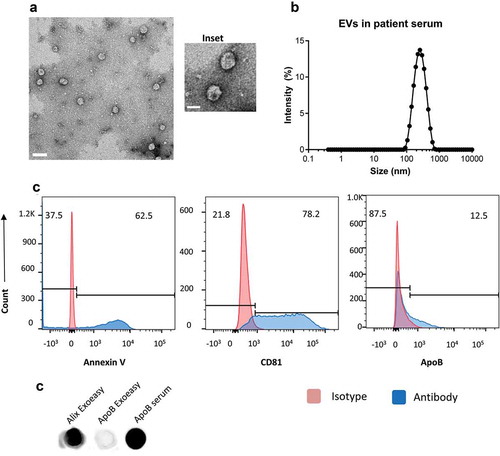
Figure 2. Biological variability is much greater than technical variability.
(a) Serum from five healthy donors was obtained to assess biological variability, and each donor was replicated five times to assess technical variability. All samples were spiked in with a mix of 52 small RNAs to measure the linearity and reproducibility of Truseq illumina sequencing. (b) Principal component analysis shows that the samples from the five biological replicates for each donor. Each donor is shown as a separate colour. (c) Pairwise scatter plots of the five technical replicates of donor 1 is shown as a measure of technical variance. (d) Principal component analysis showing separation of EV samples from healthy and RA serum.
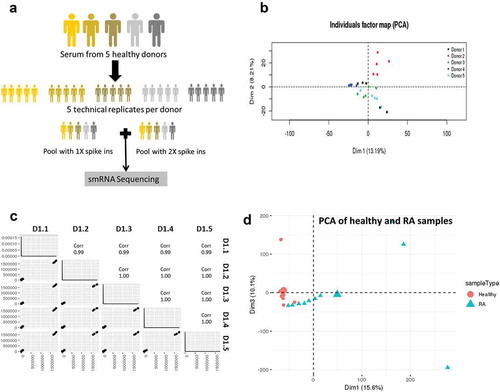
Figure 3. Spike-in analysis reveals the presence of sequencing bias in Truseq protocol.
(a) Comparison of the spike-in input concentrations (known) versus the output from the 1X samples measured in terms of number of reads mapped in the Truseq protocol showing a correlation of 0.30 which implying the presence of a bias in the protocol. (b) Comparison of the samples spiked with 1x and 2X spike-ins shows the number of reads obtained per spike-in. The solid blue line is the line of best fit, while the dashed black line shows the expected line with a slope of 2. Several spike-ins do not align on either line indicating either over or underrepresentation in the output read counts. (c) The follow-up study comprised three donors (previously used) replicated three times each (technical replicates). All nine RNA samples were spiked 1X synthetic miRNA mix and sequenced using either a Truseq small RNA protocol or a Nextflex small RNA protocol to compare which kit reduced the bias observed. (d) Shown is the comparison of the spike-in input concentration versus output reads for the Illumina Truseq (blue) and Bioo Nextflex (red) small RNA kits.
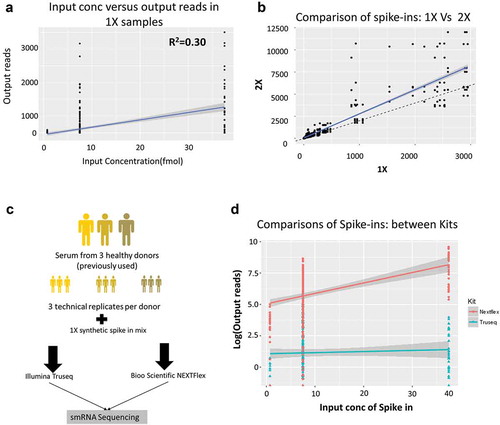
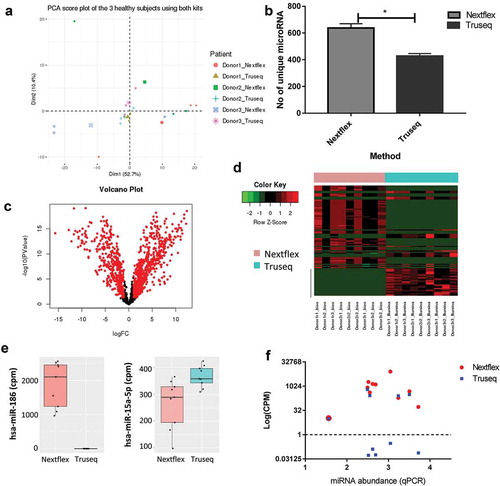
Figure 4. Choice of library preparation impacts the sequencing results obtained by small RNA-Seq.
(a) Principal component analysis shows the biological and technical variability between samples after sequencing with the Truseq and Nextflex kits. The samples were batch corrected by ComBat to account for batch-specific differences and the image are coloured by donor and kit. (b) The number of unique miRNAs detected is higher in the Nextflex kit when compared to the Truseq Kit (p-value = 0.01). (c) Volcano plots of differential gene expression between the Truseq and Nextflex kits are shown. The plots illustrate the log10 Benjamini–Hochberg corrected p-value vs. the log2 change of transcript abundance. Red indicates miRNAs that differ between kits. (d) Heatmap of the top differential expressed genes using the Nextflex and Truseq kits is shown. The horizontal bar on top depicts the samples from each kit, the colour that represents the specific kit is provided in the legend on the left of the figure. (e) Representative box plots are shown of two differentially expressed miRNA that were detected by either the Nextflex or both the Nextflex and Truseq kits. The y-axis shows the counts per million reads of the two miRNAs as detected by library preparation kit (f) Scatter plot measuring miRNA expression by sequencing (measured in log counts per million, coloured by kit) versus quantitative PCR shows that only Nextflex detected all 10 of the genes detected by qPCR. The Pearson correlation for the Nextflex kit was 0.1 against qPCR while the correlation for Truseq versus qPCR was 0.05.