Figures & data
Figure 1. Quantification of EV sizes. (a) EVs from PANC-1 cells were isolated using SEC and characterized for EV and protein concentration. Error bars represent SEM; N = 3. Protein levels for the EV markers (CD63, TSG101) and EGFR were obtained for SEC fractions 7–10 with Western blots. (b) Left, scheme of an EV affinity isolated with cetuximab and labelled with WGA-AF647 as a reporter. Right, filtered dSTORM images of WGA-AF647 with localizations in red. A single EV (top; scale bar, 100 nm) and a larger field of view (bottom; scale bar, 1 µm) are shown. (c) qSMLM size distribution of EGFR-enriched EVs from PANC-1 cells (SEC F8) using WGA-AF647 as a reporter; N = 3, 15 ROI. (d) Representative TEM image (left; scale bar 200 nm) and TEM size distribution (right) of EVs from PANC-1 cells (SEC F8); N = 3.
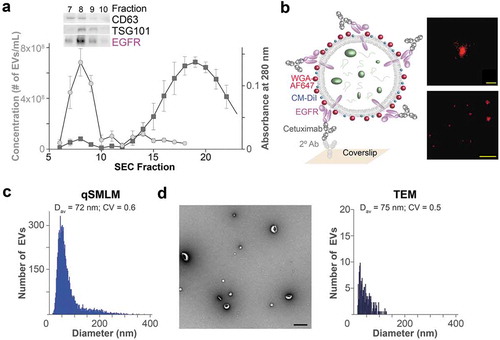
Figure 2. Quantification of EV content. (a) qSMLM quantification of EGFR-enriched EVs from PANC-1 cells using cetuximab-AF647 as a reporter. (b) Average number of detected EVs from PANC-1 cells using different dilutions. (c) qSMLM quantification of EGFR-enriched EVs from PANC-1 cells permeabilized with Triton-X 100 using cetuximab-AF647 as a reporter. (d) qSMLM quantification of EGFR-enriched EVs from HPDEC cells using cetuximab-AF647 as a reporter. (e) qSMLM quantification of CA19-9-enriched EVs from PANC-1 cells using anti CA19-9 Ab-AF647 as a reporter. (f) qSMLM quantification of CA19-9-enriched EVs from HPDEC cells using anti CA19-9 Ab-AF647 as a reporter. In all cases, SEC F8 was used; N = 3, 15 ROI.
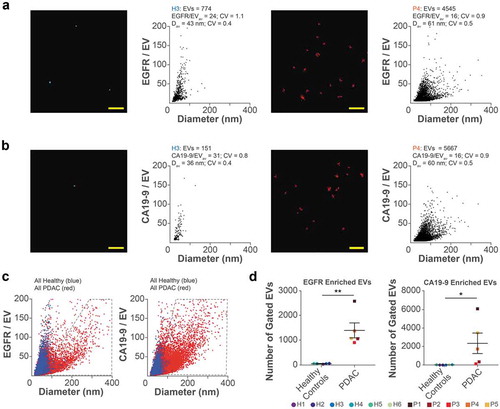
Figure 3. Quantification of EVs from patient plasma. (a) Filtered dSTORM images and qSMLM quantification of EGFR-enriched EVs from plasma of healthy subject 3 (H3, left) and PDAC patient 4 (P4, right) using cetuximab-AF647 as a reporter (N = 3, 15 ROI). (b) Filtered dSTORM images and qSMLM quantification of CA19-9-enriched EVs from plasma of healthy subject 3 (H3, left) and PDAC patient 4 (P4, right) using anti CA19-9 Ab-AF647 as a reporter (N = 2, 15 ROI). Each dot in the dSTORM images represents a localization from the corresponding fluorescent reporter. Scale bars, 1 µm. (c) Combined EGFR-enriched (left) and CA19-9-enriched (right) EVs from healthy subjects (blue) and PDAC patients (red). (d) Number of EVs in gated area (grey polygons, panel c). In all cases, SEC F8 was used.