
Figures & data
Figure 1. Characterisation of EVs derived from LIM1215 CRC cells.
(A) The circos plot represents the genomic and proteomics data obtained from exome sequencing of cells and MS analysis of EVs, respectively. (B) MS/MS spectra of mutant β-catenin (T41 > A) peptide identified in EVs is depicted. (C) Western blot analysis of LIM1215 whole-cell lysate (WCL) for β-catenin and enrichment of β-catenin and EV-enriched markers in EV pellet compared to secretome and 10K. (D) NTA depicting the size distribution of EVs isolated from LIM1215 CRC cells. (E) Western blot analysis (10 µg) of fractions collected from OptiPrepTM density gradient centrifugation (LIM1215 cells) showed enrichment of β-catenin, Alix and TSG101 in fraction 7 and 8. (F) A TEM image of EVs (fraction 7) isolated by OptiPrepTM gradient corresponding to density 1.10 g/mL. (G and H) Western blotting of a panel of CRC cells (20 μg) with mutated and wild-type β-catenin for Alix, TSG101and β-catenin. Western blot analysis indicated the presence of Alix, TSG101 and β-catenin in EV samples (20 μg) isolated from CRC cells carrying both mutated and wild-type β-catenin.
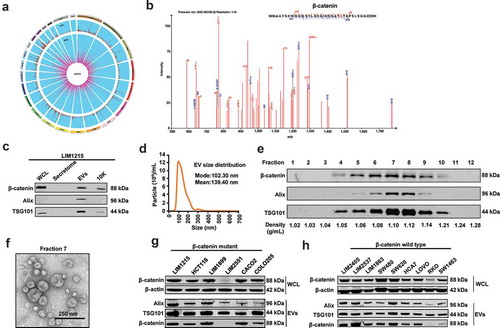
Figure 2. Endogenous localisation of β-catenin in LIM1215 and RKO cells.
(A) Confocal microscopy was performed to determine the localisation of β-catenin (green fluorescence) in LIM1215 and RKO cells. Cells were fixed on the coverslip and stained with anti-β-catenin. β-catenin was mainly localised to the nucleus and to an extent in plasma membranes in LIM1215 cells (scale bar, 20 μm). In RKO cells, wild-type β-catenin was mainly localised to the cytoplasm (scale bar, 40 μm). (B) LIM1215 and RKO cells were transfected with TOPFlash/FOPFlash and renilla plasmids. After 24 h, cells were lysed and analysed for luciferase activity. LIM1215 cells exhibited higher level of Wnt signalling activity compared to RKO cells. Error bar represents ±SEM; **denotes P ≤ 0.01, n = 3. (C) Schematic diagram of co-culture of LIM1215 and RKO cells. (D) RKO cells cultured with LIM1215 cells showed a 2.5-fold increase in Wnt signalling activity. (E) Western blotting for Wnt target gene expression in RKO cells. C: Control; T-Treated (co-culture with LIM1215 cells). (F) LIM1215 cell-derived EVs (100 µg) were incubated with RKO cells for 1, 2 and 4 h at 37°C. PKH67-labelled EVs were taken up by RKO cells after 4 h. Fluorescence was captured using a confocal microscope, Zeiss LSM 510 (magnification, × 100, scale bar 10 μm). (G) Upon incubation of EVs (30 µg/mL), Wnt signalling activity was 2-fold higher in LIM1215 and 5-fold higher in RKO cells compared to their respective controls. Error bar represents ±SEM; **denotes P ≤ 0.01, n = 3. (H) Wound healing assay of RKO cells in the presence (T) and absence of EVs (C – 30 µg/mL). Error bar represents ±SEM; **denotes P ≤ 0.01, n = 3.
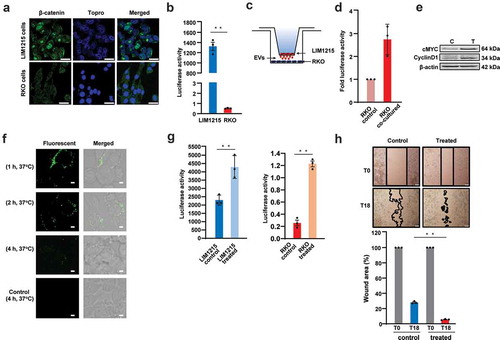
Figure 3. EVs activate Wnt signalling pathway in recipient RKO cells.
(A) Western blotting of RKO cells with increasing concentration of EVs showed a dose-dependent increase in cMYC protein levels. (B) qPCR analysis revealed increased mRNA expression of cMYC and Cyclin D1 upon treatment of RKO cells with 2 different concentrations of EVs (* denotes P ≤ 0.05, n = 3, Error bar represents ±SEM). (C) Confocal microscopy revealed increased expression levels of β-catenin in RKO cells incubated for 24 h with 150 µg/mL of LIM1215-derived EVs, compared to the control RKO cells. Fluorescence was captured using a confocal microscope, Zeiss LSM 510 (magnification, × 100, scale bar 10 μm). (D) Venn diagram depicts the number of proteins transferred from EVs to the cytoplasm and nucleus of the RKO cells. (E) MS/MS spectrum of a lightly labelled peptide from mutant β-catenin transferred to the nucleus of the RKO cell.
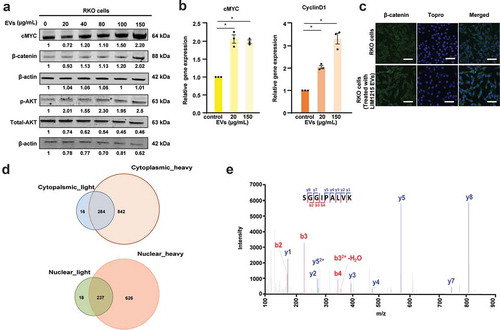
Figure 4. EVs activate Wnt signalling and increase tumour burden in vivo.
(A) DiR-labelled EVs and PBS control were subjected to fluorescent imaging using IVIS in a 96-well plate. DiR-labelled EVs showed a strong fluorescent signal as opposed to no signal in the control treated with PBS. (B) In vivo fluorescence images of CRC RKO mouse xenograft model injected with DiR-labelled LIM1215 cell-derived EVs at 24 and 96 h. Values correspond to total radiant efficiency [(p/sec/cm2/sr)/(µW/cm2)], n = 5. (C) IVIS images from representative organs from mice injected with labelled EVs (10 µg) and PBS. Values correspond to total radiant efficiency [(p/sec/cm2/sr)/(µW/cm2)], n = 5. (D) Western blot analysis was performed on tumour tissue lysates. Protein levels of the Wnt target gene cMYC was evaluated (n = 4). (E) qPCR analysis was performed on tumour tissue lysates from control and EV-treated mice. The mRNA expression of Wnt target genes (cMYC, Cyclin D1 and Axin2) was found to be elevated in EV-treated mice compared to control mice. Error bar represents ±SEM; *denotes P ≤ 0.05, n = 4. (F) Schematic diagram representing the mouse experiment to examine the relative tumour burden. (G) Mice administered with EVs (10 µg) showed a significant increase in tumour volume (* denotes P ≤ 0.05, n = 4, Error bar represents ±SEM).
![Figure 4. EVs activate Wnt signalling and increase tumour burden in vivo.(A) DiR-labelled EVs and PBS control were subjected to fluorescent imaging using IVIS in a 96-well plate. DiR-labelled EVs showed a strong fluorescent signal as opposed to no signal in the control treated with PBS. (B) In vivo fluorescence images of CRC RKO mouse xenograft model injected with DiR-labelled LIM1215 cell-derived EVs at 24 and 96 h. Values correspond to total radiant efficiency [(p/sec/cm2/sr)/(µW/cm2)], n = 5. (C) IVIS images from representative organs from mice injected with labelled EVs (10 µg) and PBS. Values correspond to total radiant efficiency [(p/sec/cm2/sr)/(µW/cm2)], n = 5. (D) Western blot analysis was performed on tumour tissue lysates. Protein levels of the Wnt target gene cMYC was evaluated (n = 4). (E) qPCR analysis was performed on tumour tissue lysates from control and EV-treated mice. The mRNA expression of Wnt target genes (cMYC, Cyclin D1 and Axin2) was found to be elevated in EV-treated mice compared to control mice. Error bar represents ±SEM; *denotes P ≤ 0.05, n = 4. (F) Schematic diagram representing the mouse experiment to examine the relative tumour burden. (G) Mice administered with EVs (10 µg) showed a significant increase in tumour volume (* denotes P ≤ 0.05, n = 4, Error bar represents ±SEM).](/cms/asset/479e37d6-a7a3-45d7-b066-5edb4f9e1768/zjev_a_1690217_f0004_oc.jpg)