Figures & data
Figure 1. Gating strategy of flow cytometric (FC) EV detection. Representative dot plots of FC measurements. a. Fluorescence threshold was set in pure HBSS in the yellow fluorescence channel (585 nm) against forward scatter plot. b. Spherotech beads (3.8 μm) were used to set the upper size limit of EV gate. c. Representative dot plot of CD11b PE labelled EV. d. Representative dot plot of isotype PE antibody labelled EV. e. Representative dot plot of 0.1% Triton X-100 treated CD11b PE labelled EV. f. Relation of EV count to serial dilution. The x axis indicates the final volume used for resuspension of the sedimented EVs. Three representative measurements. The arrows indicate the dilution used routinely.
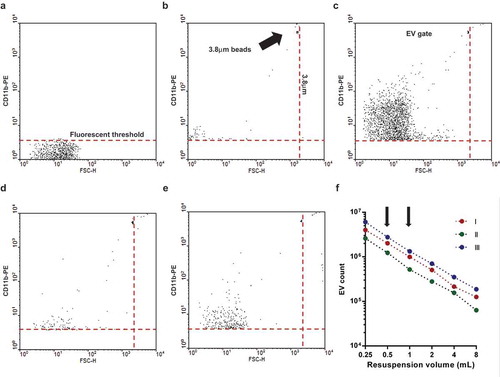
Figure 2. Complement receptor activation induces aEV production in human PMN. a. Quantification of EV production by flow cytometry (FC, left axis) and protein amount measurement (right axis) after activation with non-opsonized (zEV), partially (abzEV) or completely (aEV) opsonized zymosan. Data were compared by using two-way ANOVA coupled with Tukey’s post hoc test; n = 22, 26. Level of significance is indicated by * for EV numbers and by # for protein amount. FC quantification of EV production by adherent PMN on immune complex (IC) surface (b.) and on C3bi or bovine serum albumin (BSA) surface (c.). C3bi or bovine serum albumin (BSA) surface. Data were compared using paired Student’s t-test, n = 8 and 4. d. Bacterial survival in the presence of different types of EVs released from 5 × 10⁶ PMN. Data were compared to sEV using RM one-way ANOVA coupled with Dunnett’s post hoc test; n = 11. e. Quantification of EV production (left axis) and protein amount measurement (right axis) from PMN pretreated without or with dasatinib. Data were compared by using two-way ANOVA coupled with Tukey’s post hoc test; n = 7,11. Level of significance is indicated by * for EV numbers and by # for protein amount. f. Quantification of bacterial survival in the presence of aEV from PMN preincubated without or with dasatinib. Data were compared to sEV using RM one-way ANOVA coupled with Dunnett’s post hoc test n = 5.
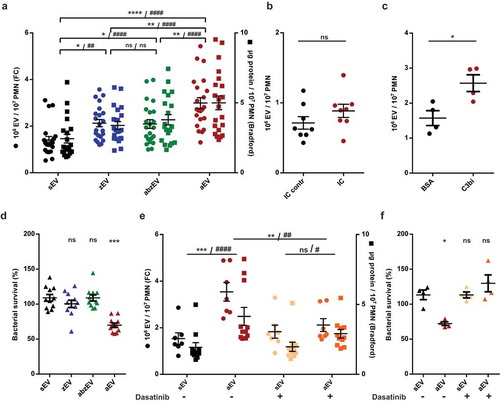
Figure 3. Characterization of EVs derived of human PMN. a. Size distribution spectra of EVs measured by DLS. Broken line represents 0.1% Triton X-100 treated aEV. Signal above 1000 nm is due to zymosan contamination. Representative pictures of one out of three similar experiments. Representative electron microscopic images of human sEV (b.), zEV (c.), abzEV (d.), aEV (e.), and aEV prepared from dasatinib pretreated PMN (f.). Original magnification is 30,000×, representative pictures out of three similar experiments. g. Size distribution spectra of human EVs based on electron microscopy images of one representative experiment, data originate from 400 EVs pro samples. The dotted line represents the possible limit of detectability by flow cytometry.
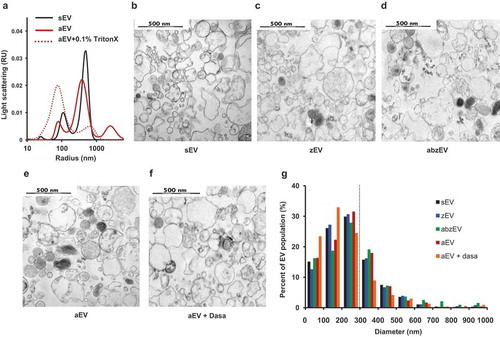
Figure 4. Complement receptor activation induces enrichment of granule proteins in EVs. a. Label-free quantitative analysis of granule protein presence in different EVs derived from human PMN. Analysis of one out of 2 similar experiments. b. Label-free quantitative analysis of proteomics data on typical granule proteins of sEV and aEV obtained from untreated or dasatinib pretreated human PMN. Dotted line represents sEV data as value 1; mean and individual values normalized to sEV; line represents mean ± SD. c. Representative Western blot of lactoferrin (LTF), myeloperoxidase (MPO) and actin in EVs. Representative images out of 11 or 6 independent experiments. d. Densitometric analysis of the Western blots. LTF and MPO were related to actin. Data were compared by using two-way ANOVA coupled with Tukey’s post hoc test; n = 11, 6. Level of significance is indicated by * for LTF and by # for MPO.

Figure 5. Characterization of murine PMN derived EVs. a. Quantification of EVs produced spontaneously (sEV) and after activation with non-opsonized (zEV) or completely (CabzEV) opsonized zymosan. Data were compared to sEV using one-way ANOVA coupled with Dunnett’s post hoc test; n = 32. Representative electron microscopic images of sEV (b.) and CabzEV (c.) prepared from WT murine PMN. Original magnification is 30,000×. Representative pictures out of 3 similar experiments. d. Size distribution spectra of murine EVs based on electron microscopy images, data originate from 200 EVs pro samples. The dotted line represents the possible limit of detectability by flow cytometry. e. Size distribution spectra of EVs measured by DLS. Broken line represents 0.1% Triton X-100 treated aEV. Signal above 1000 nm is due to zymosan contamination. Representative results out of 3 independent experiments.
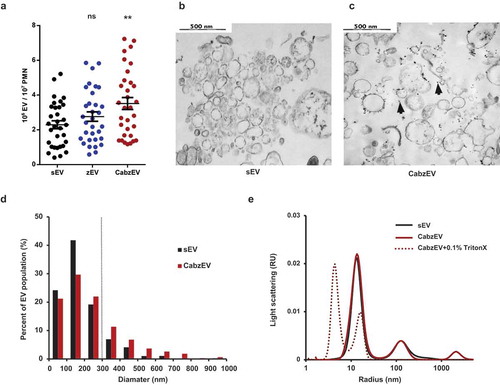
Figure 6. Mac-1/CR3 has a key role in CabzEV production in murine PMN. Comparison of sEV and CabzEV production of WT vs. FcRγ-chain KO (a.), CD18 KO (b.), and CD11b KO (c.) murine PMN. Labelling was carried out in the experiments of panels b. and c. with annexinV. Data were compared using one-way ANOVA coupled with Bonferroni’s post hoc test; n = 27, 22, 21.
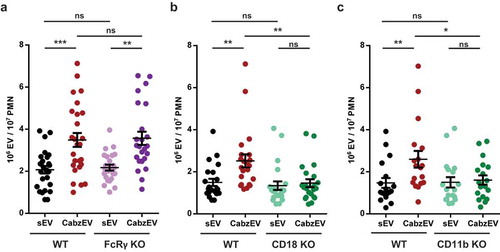
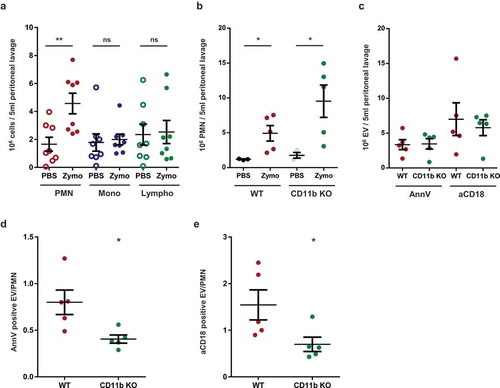
Figure 7. Mac-1/CR3 plays a crucial role in peritoneal EV production during zymosan induced peritonitis in mice. a. Absolute number of different leukocytes in the peritoneal lavage at 2 h after zymosan or PBS injection. Data were compared using paired Student’s t-test, n = 8 b. Absolute number of neutrophils in the peritoneal lavage at 2 h after zymosan or PBS injection. Data were compared using Student’s t-test; n = 5. c. Absolute number of annexinV or CD18 positive EVs in the peritoneal lavage at 2 h following zymosan injection; n = 5. AnnexinV (d.) or CD18 (e.) positive EV vs PMN ratio in the peritoneal lavage at 2 h after zymosan injection. Data were compared using Student’s t-test; n = 5.