Figures & data
Figure 1. Study overview. Human primary astrocytes were isolated from conceptual brain tissues and cultured as adherent cells. IL-1β (1 ng/mL) was added in the culture to induce astrocyte reactivity. After 24 h, cultured media were removed and cells were washed with PBS three times, and then incubated with EV-depleted media for four days. EVs were isolated from the conditioned media by differential centrifugation combined with fractionation with qEV columns.
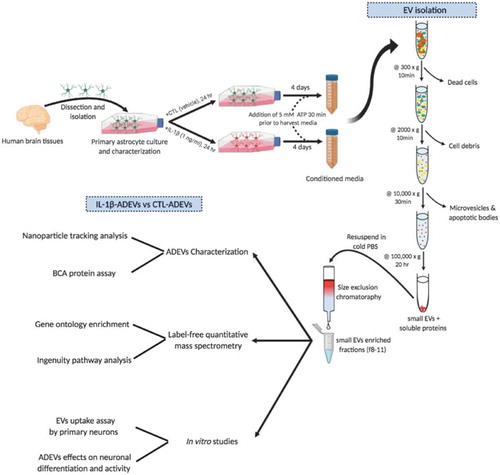
Figure 2. Isolation and characterization of extracellular vesicles from control astrocytes and IL-1β-treated astrocytes. (a) The yield of IL-1β-ADEVs, expressed as the number of isolated particles per mL media, was significantly higher than that of CTL-ADEVs (n = 5). (b) The nanogram protein of EVs per mL media (c) and the amount of protein per particle was not significantly different between the two groups (n = 5). (d) Representation of size distribution of CTL- and IL-1β-ADEVs by nanoparticle tracking analysis (n = 5). Data are expressed as mean ± SEM. n.s., no significance; *p < 0.05 compared to control group as determined by student’s t-test using Graphpad prism 6.
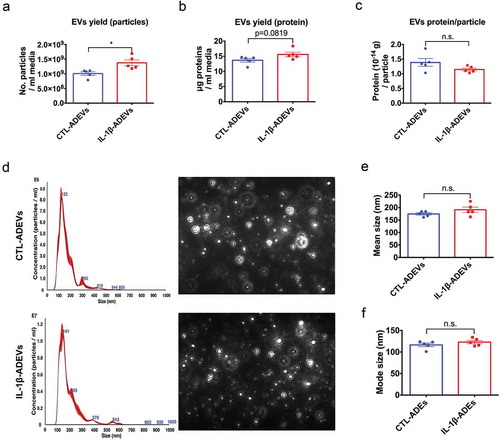
Table 1. Presence of well-known EV markers and astrocyte-specific proteins in proteomic profiling of ADEVs.
Figure 3. The proteome profile of CTL- and IL-1β-ADEVs. A total of 875 proteins were identified by mass spectrometry. All identified proteins were submitted to the GO classification system using Funrich analysis. (a–c) The percentage of proteins in the six most enriched categories and the enrichment significance (−log10 (p-value), p < 0.05) of identified proteins in (a) cellular components, (b) molecular functions, and (c) biological process categories were identified. The percentage of proteins identified in each category is indicated. (d) Volcano plot of the proteomic data between CTL- and IL-1β-ADEVs. Y axis of the plot represents significance (−log10 of p value) and the x axis shows the log2 of the fold-change (expression in IL-1β-ADEVs/expression in CTL-ADEVs). The red dots represent the proteins that are significantly upregulated in the IL-1β-ADEVs compared to CTL-ADEVs. The fold changes of proteins not statistically significant are represented as black dots. The dashed blue lines represent a criteria of p < 0.05 (−log10 (p value) >1.3) and fold change >2 (log2 FC >1 or <−1). The proteins with – log10 (p value) >2 or log2 FC> 5 are indicated. (e) Heatmap of 40 significantly upregulated proteins in IL-1β-ADEVs (n = 5) versus CTL-ADEVs (n = 5) using quantitative iBAQ value, with depletion depicted in blue and enrichment in red.
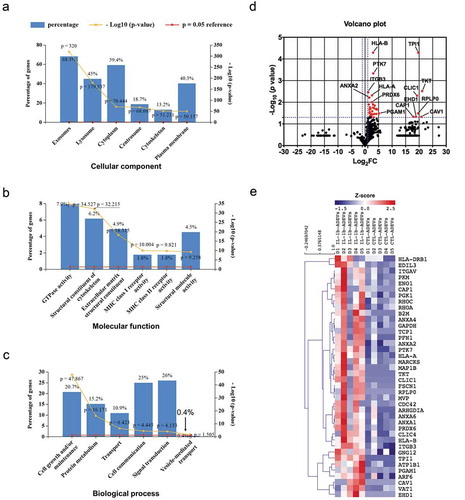
Table 2. List of top 10 up-regulated proteins based on fold change in EVs from reactive astrocytes compare to control astrocyte.
Figure 4. Ingenuity pathway analysis (IPA) of differentially expressed proteins (DEPs) in IL-1β- versus CTL-ADEVs. (a) Total 147 DEPs and their expression values were used as input for IPA. Curated list of the 15 most significantly enriched canonical pathways: cell metabolism and organization, cellular communication and inflammatory response. A statistically significant p-value of 0.05 is indicated on the plot as a vertical dashed line, at the x-value of 1.30. (b) Heatmap of result from diseases and functions annotation performed by IPA, which are associated with cellular assembly and organization, cellular movement and inflammatory response. (c) The iBAQ value of integrins between CTL- and IL-1β-ADEVs. Data are presented as mean ± SEM of n = 5 for both groups. *p < 0.05, **p < 0.01 compared to control group as determined by paired Student’s t-test. (d) DEPs in IL-1β-ADEVs mapping to the integrin-mediated signal cascades conducted by IPA. The highlighted proteins indicate the activated regulation. (e) Consistence of DEPs in IL-1β-ADEVs with the increased signalling of potential upstream regulators including TGF-β1, LPS and IL-1β. Blue colour indicates the upstream regulators; red colour scales the up-regulation of proteins in IL-1β-ADEVs; Red and orange lines indicate leading to activation by predicted relationships.
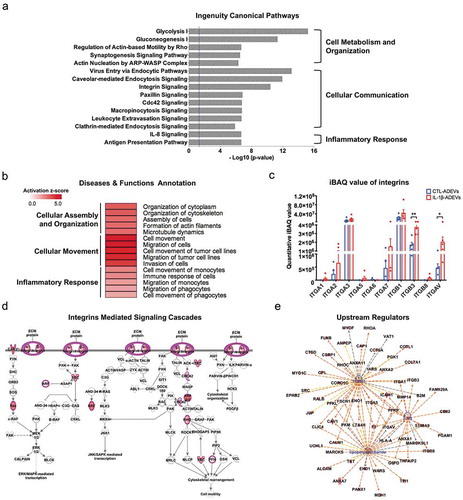
Figure 5. Increased cellular uptake of IL-1β-ADEVs compared to CTL-ADEVs by primary cultured neurons in vitro. (a) The scheme of in vitro ADEVs uptake. Both pooled CTL-ADEVs and IL-1β-ADEVs were labelled with PKH26 and equal amount of purified PKH26-labelled ADEVs were added to primary cultured cortical neurons at DIV 10 and imaged by in a live cell imaging system for three days. As a control, PKH26 dye was incubated and monitored in the same manner. (b) Representative images of the indicated time. White arrow shows the fluorescent signals within the cells. Scale bar, 200 μm. (c, d) Quantification of ADEVs uptake efficiency using Incucyte software to measure (c) total integrated intensity of red fluorescence per mm2 at each time point and Image J to count the number of PKH26+ cells at 0, 24, 48 and 72 h, across three independent experiments (d). Data are present as mean ± SEM. **p < 0.01, ****p < 0.0001 with PKH26-IL-1β-ADEVs compared to PKH26-CTL-ADEVs as determined by repeated measure two-way ANOVA with Tukey’s multiple comparisons.
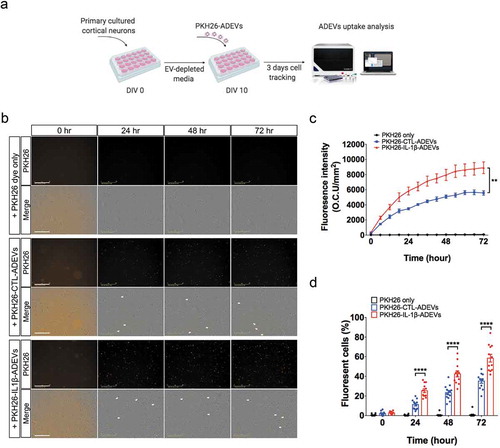
Figure 6. Inhibition of integrins in IL-1β-ADEVs reduced the EVs uptake by primary cultured neurons in vitro. (a) The scheme of in vitro IL-1β-ADEVs uptake with integrin inhibition. Purified PKH26-labelled IL-1β-ADEVs were pre-treated with integrin inhibitor RGD peptide (0.1μM or 1μM) at 37°C for 30 min, and equal amount of pre-treated PKH26-IL-1β-ADEVs were added to primary cultured mouse cortical neurons at DIV 10, which were imaged by a live cell imaging system for three days. (b) Representative images of the indicated time. White arrow shows the fluorescent signals within the cells. Scale bar, 200 μm. (c, d) Quantification of PKH26-IL-1β-ADEVs uptake using IncuCyte software to measure (c) total integrated intensity of red fluorescence per mm2 at each time point and Image J to count (d) the number of fluorescent cells at 0, 24, 48 and 72 h, across three independent experiments. Data are present as mean ± SEM. *p < 0.05, **p < 0.01, ****p < 0.0001 with PKH26-IL-1β-ADEVs + 0.1μM RGD peptide or PKH26-IL-1β-ADEVs + 1 μM RGD peptide compared to PKH26-IL-1β-ADEVs + vehicle as determined by repeated measure two-way ANOVA with Tukey’s multiple comparisons.
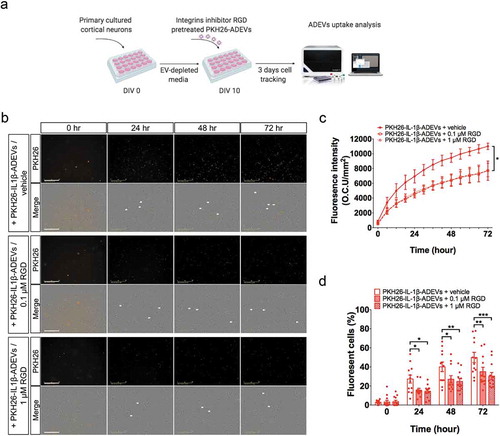
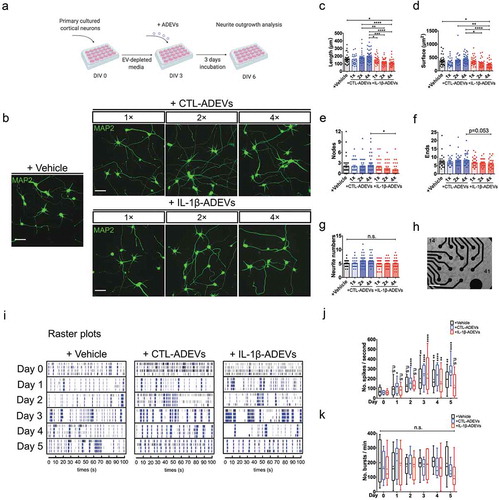
Figure 7. IL-1β-ADEVs exert suppressive effects on neurite outgrowth and neural spike firing. (a) The scheme of ADEV’s effects on neurite outgrowth. Different doses of purified CTL-ADEVs and IL-1β-ADEVs were added to primary cultured mouse cortical neurons at DIV 3 and incubated for three days. Neurite outgrowth analysis was performed at DIV 6 using Neurolucida imaging software. (b) Representative fluorescent images of MAP2+ cortical neurons after three-day exposure to the indicated concentrations of CTL- and IL-1β-ADEVs (1×, 1.25 μg/mL; 2×, 2.5 μg/mL; 4×, 5 μg/mL). Control group was treated with vehicle instead of ADEVs. Scale bar, 50 μm. Quantification of neurite outgrowth show (c) neurite length, (d) surface area, (e) number of nodes, (f) number of neurite ends, and (g) total neurite number for the indicated concentrations of ADEVs. Data are present as mean ± SEM from three independent experiments. n.s., no significance; *p < 0.05, **p < 0.01, ***p < 0.001, ****p < 0.0001 as determined by ordinary one-way ANOVA with Tukey’s multiple corrections (c, d) and non-parametric test with Dunn’s multiple corrections (e–g). (h) Multi-electrode array (MEA) for monitoring neural spike firing after treating primary neurons with CTL- and IL-1β-ADEVs from DIV 17. Phase-contrast image of primary neurons cultured on an MEA plate at DIV 17. Scale bar, 500 μm. (i) Representative raster plots show the spontaneous firing activities recorded from primary neurons after incubation with ADEVs during a five-day time course. Quantitation of (j) the number of spikes per second (k) and the number of bursts per min from primary neurons incubated with vehicle, CTL- or IL-1β-ADEVs during day 0 to 5. Data were collected from 8 MEAs (2 replicates × 4 independent experiments). Box and whisker plots are used to show the median and the 5th to 95th percentiles; Plus sign indicates the means. n.s., no significance; *p < 0.05, **p < 0.01, ****p < 0.0001 compared to day 0, respectively, as determined by repeated measure two-way ANOVA with Sidak’s multiple corrections.