Figures & data
Table 1. MIFlowCyt-EV framework.
Table 2. Example of a completed MIFlowCyt-EV framework.
Table 3. Summary of reagents used for FC experiments.
Figure 1. Overview of the MIFlowCyt EV Reporting Framework. The left column shows each category of the reporting framework and the middle column shows the components within each category, the right-hand column shows the broad objective of each row. *Highlights the component that are broadly applicable to the majority of single-EV analysis experiments regardless of design or instrumentation. **Highlights the components that are only applicable in cases where certain reagents or protocols are used.
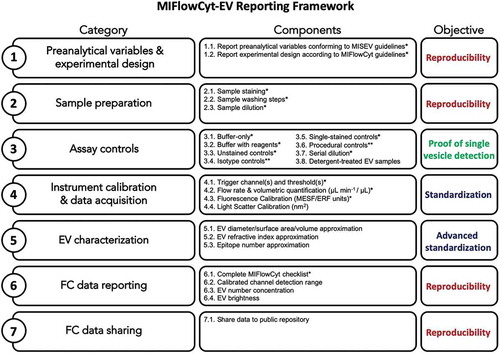
Figure 2. Summary of a poll about what extracellular vesicles (EV) flow cytometry (FCM) working group (WG) members expect to be reported in scientific manuscripts on EV-FC. The top chart shows the number of working group members who have experience reviewing manuscripts from the ISEV, ISAC, ISTH journals (red) and those that have not (white). The bottom bar graph summarizes the personal expectations of all co-authors regarding components to be reported in EV-FC manuscript published in ISEV, ISAC and ISTH journals. The expectations fall into categories of all (blue), most (green) or select/specialized (yellow) manuscripts.
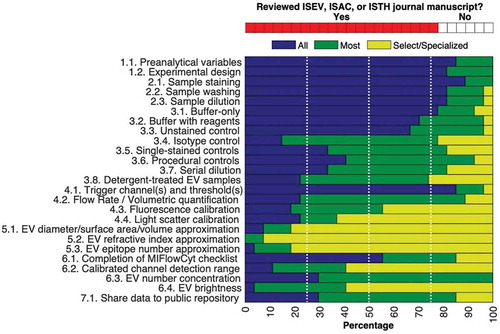
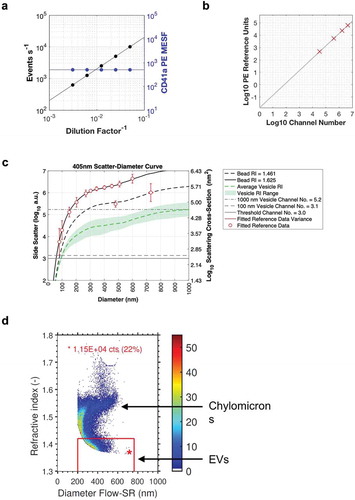
Figure 3. (a) Example plot of reporting serial dilutions data, with event count per second on the left y-axis, median PE MESF intensity of the recorded data on the right y-axis and the dilution factor on the x-axis. (b) Example plot of reporting fluorescence calibration using regression. The fluorescent intensity in arbitrary units (channel number) is on the x-axis with the related fluorescence population reference units on the y-axis. (c) Example plot of light scatter calibration at 405 nm using FCMPASS software default values. (d) Example plot of refractive index and diameter determination using Flow-SR. methodology.