
Figures & data
Figure 1. ExoHeLa down-regulated tight junctions and destroyed the barrier function of endothelial monolayers in vitro. (a) HUVECs were grown on the inserts of a dual well plate for 24 hrs to form endothelial monolayer. After treated with ExoHeLa or ExoHCEC for 24 hrs, GFP-labelled SiHa cells were loaded on the upper chamber and allowed for migration for 12 hrs. (b) GFP+ SiHa cells migrated through HUVEC monolayer were observed on the other side of the inserts under fluorescent microscopy. (c) The number of migrated cells in B were quantified (n = 6). (d) Similarly, after HUVECs monolayer on the inserts were treated with ExoHeLa or ExoHCEC for 24 hrs, FITC-Dextran (70kD) was added into the upper chamber. The fluorescence in the bottom wells was measured at different times. (e) Protein levels of ZO-1 and CLDN5 in HUVECs after treated with either 2.5 μg/mL or 5 μg/mL ExoHeLa were analysed by western blot. (f) mRNA levels of ZO-1 and CLDN5 in HUVEC were evaluated by real-time quantitative RT-PCR after the cells were treated with 5μg ExoHeLa or ExoHCEC or PBS for 48 hrs. (g) After treated with ExoHeLa or ExoHCEC for 48 hrs, HUVEC monolayers analysed by immunofluorescence for ZO-1 and CLDN5 (green). The nuclear were stained with Hoechst 33258 (blue). *P< 0.05, **P< 0.01.
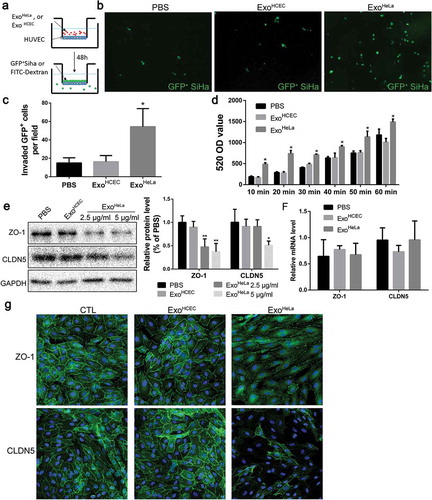
Figure 2. ExoHeLa increased vascular permeability in vivo. ExoHeLa or ExoHCEC or PBS were intravenously injected into the tail veins of Balb/c nude mice (n = 4 for PBS group, n = 3 for ExoHCEC group and n = 6 for ExoHeLa group) three times a week for ten times. (a) FITC-dextran (70kD) was intravenously injected and the leakage of FITC-dextran out of the ear vessel was examined alive under confocal microscope. (b) Fluorescent leaking out of vessels was quantified using image J as Mean Fluorescence Intensity (MFI). (c) Nude mice were sacrificed afterwards, and the appearance of injected FITC-dextran was examined in lung. (d) The number of FITC-dextran dots was quantified and data were presented as FITC-dextran dots/nuclei ratio. **P< 0.01.
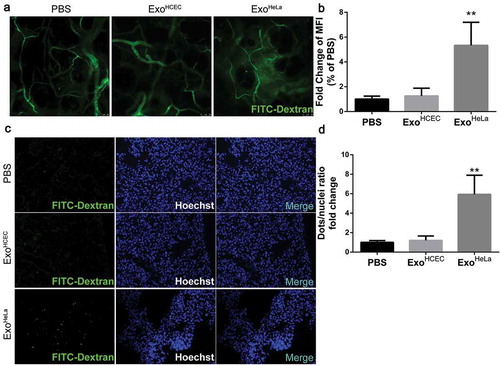
Figure 3. ExoHeLa promoted tumour metastasis in vivo. Luciferase-labelled 4T1 cells were injected into # 4 mammary fat pads of the nude mice. The mice simultaneously were injected with PBS, ExoHCEC, or ExoHeLa as indicated through tail vein (n = 5 for each group). (a) Bioluminescent imaging (BLI) at Day 0, 14 and 21 was examined. (b) Luminescence at Day 14 and 21 in A was quantified. (c) Mice were sacrificed on Day 21. Lungs were harvested and metastases were visualized after fixed with 4% paraformaldehyde containing 10% picric acid. White spots are the metastasized tumours. (d) Quantification of metastasis spots in C. (e). Representative images of lung sections showing tumour metastases in lungs after they were stained with haematoxylin and eosin. Metastasis tumours were stained into purple. (f) Quantification of metastasis spots in E. *P< 0.05, **P< 0.01.
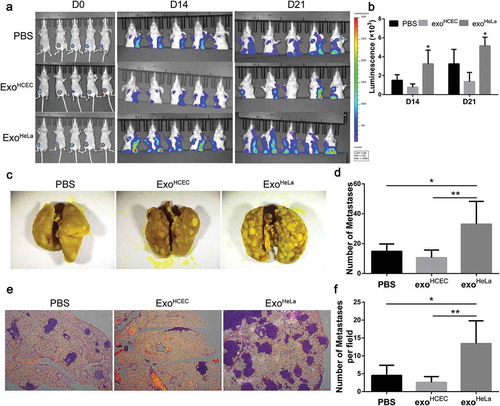
Figure 4. Exosomal microRNAs were not responsible for the ExoHeLa-induced down-regulation of TJ proteins. ExoHeLa was treated with or without triton X100 before being co-incubated with HUVECs for 48 hrs. (a) Protein levels of ZO-1 and CLDN5 of HUVECs were evaluated by western blot. (b) RNA was extracted from exoHeLa and exoHCEC, small RNAs were analysed, and the most abundant small RNAs were listed. (c) Based on the small RNA sequencing results, HUVECs were treated with corresponding microRNA inhibitors along with exoHeLa, then analysed by western blot for protein level of ZO-1 and CLDN5. Quantification of ZO-1 and CLDN5 expression were presented as the percentage of that of PBS group, and the data are shown in a bar graph. (d) Quantification of DICER mRNA in HeLa cells using real-time quantitative PCR after the cells were treated with small interference RNA to knocked down DICER mRNA, (e) Protein level of DICER was examined by western blot. (f) Exosomes secreted by HeLa cells and DICER knocked down (DICER KD) HeLa cells were collected, exosomal RNA was extracted from exoHeLa and exoHeLa DICER KD. MiR1290 and miR3960 levels were analysed by Real-time quantitative PCR. (g) After treated with exoHeLa and exoHeLa DICER KD for indicated duration, HUVECs were subjected to western blot analysis for ZO-1 and CLDN5 proteins. *P< 0.05, **P< 0.01, ***P< 0.001, ****P< 0.0001.
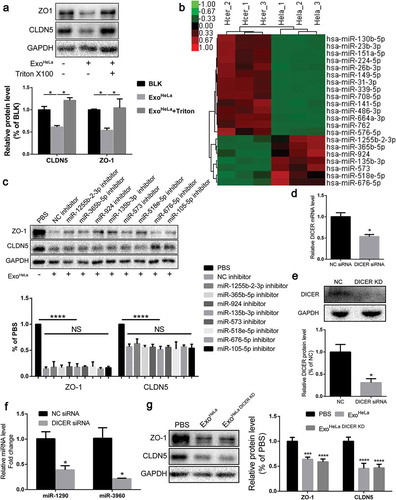
Figure 5. Reduction of TJ proteins in ExoHeLa treated HUVECs was not through ubiquitination or autophagy. (a) HUVECs were preconditioned with PBS or MG132 followed by treatment with ExoHeLa as indicated. Protein levels of ZO-1 and CLDN5 were analysed by western blot and quantified. (b) After treated with either PBS or ExoHeLa, HUVECs were visualized under transmission electron microscopy. Autophagosomes were indicated using black arrows. (c) HUVECs were treated with ExoHeLa for specified times, and the protein level of mTOR, P62 and LC3B I/II was analysed by western blot. (d) HUVECs were preconditioned with PBS or CQ followed by treatment with ExoHeLa. ZO-1 and P62 proteins were evaluated by western blot. Quantification of the proteins was shown in the bar graph. (e) Similarly, after HUVECs were treated with 3MA along with ExoHeLa, ZO-1 and CLDN5 proteins were evaluated by western blot. Quantification of the proteins was shown in the bar graph. *P< 0.05, **P< 0.01, ***P< 0.001, ****P< 0.0001.
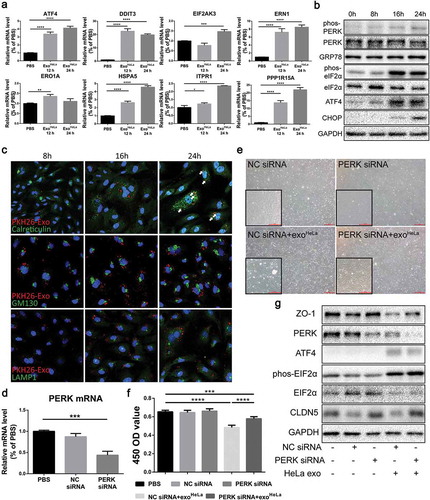
Figure 6. ExoHeLa triggered ER stress in HUVECs. (a) The mRNAs of ER stress-related genes in HUVECs were analysed by Real-time quantitative PCR. The relative mRNA levels were presented in comparing with those in PBS-treated HUVECs. (b) The expressions of ER stress-related proteins in ExoHeLa treated HUVECs were analysed by western blot. (c) ExoHeLa was labelled with fluorescent dye PKH26 (red) and then mixed with HUVECs for the specified times. After HUVECS were fixed in 4% paraformaldehyde and subjected to immunofluorescence staining with Abs against either Calreticulin for ER (green) or GM130 for Golgi (green) or LAMP1 for lysosome (green). Cell nuclear was labelled with Hoechst 33258 (blue). Cellular distribution of the uptaken ExoHeLa in HUVECs was observed under laser confocal microscope. (d) PERK gene in HUVECs was knocked down by small interference RNA and confirmed by Real-time quantitative PCR. (e) Morphological change between normal HUVECs and PERK KD HUVECs treated with exoHeLa. Magnification: origin×40, inserter×100; (f) Cell proliferation measured by CCK8 and (g) ZO-1 and CLDN5 proteins by western blot were analysed for HUVECs after treated with the specified siRNA and ExoHeLa. *P< 0.05, **P< 0.01, ***P< 0.001, ****P< 0.0001.
Supplemental Material
Download MS Word (4.6 MB)Data availability statement
The data that support the findings of this study are available from the corresponding author upon reasonable request.