
Figures & data
Table 1. Demographic and clinical parameters in controls (Ctrl, n = 100) and PAD patients (n = 317) before, and after classifying PAD by disease severity in intermittent claudication (IC, n = 188) and critical limb ischaemia (CLI, n = 129).
Figure 1. Platelet-derived EVs are most abundant in PAD patients. (a) Gate definition for flow cytometry analysis on platelet free-plasma using the violet side scatter (Violet-SSC) against the regular SSC. The gate was established using calibrated beads ranging from 250 nm to 1.34 µm. (b) The number and cellular origin of EVs was measured in platelet-free plasma of PAD patients by flow cytometry (n = 45). Specific antibodies for: platelets (PEVs, anti-CD41/CD61 in grey), erythrocytes (EryEVs, anti-CD235a in red), endothelial cells (EndEVs, anti-CD62E in green), and leukocytes (LeuEVs, anti-CD11b in blue) were used. Platelet derived EVs were most abundant followed by erythrocyte, endothelial and leukocyte derived EVs. Data are presented as EVs/µL. (c) Combined flow cytometry analysis for EVs cellular origin and Annexin V staining in platelet-free plasma of PAD patients. Annexin V percentage was calculated for each EVs subpopulation based on the total number of platelet, erythrocyte, endothelial and leukocyte EVs numbers respectively. (d) Correlation between the clotting time of platelet-free plasma, measured by the Procoag-PPL kit, and the number of platelet-derived EVs (PEVs, log transformed) in PAD patients (n = 43). *p < 0.01 vs. PEVs. #p < 0.01 vs. EryEVs. †p < 0.01 vs. EndEVs.
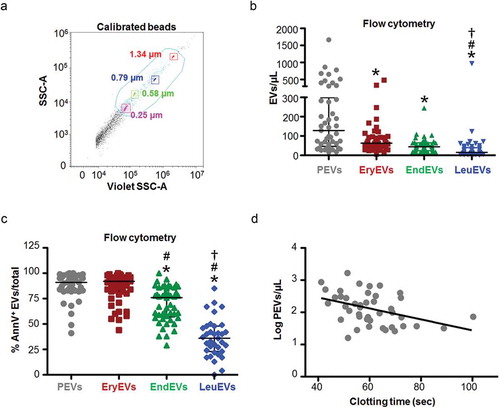
Figure 2. Characterization of isolated EVs. (a) Representative size distribution histogram for platelet-free plasma derived EVs. The NTA analysis shows a polydisperse heterogeneous vesicle population, the vast majority of them ranging from 100 to 400 nm. (b) Western blot for EVs (Alix and EMMPRIN) and non-EVs markers (ApoB100 and ApoA1) on EVs samples isolated from platelet-free plasma (n = 2). The first line on the left corresponds to the molecular weight marker (MW, kDa) of each detected protein. (c) Representative cryo-electron micrographs of EVs isolated from platelet-free plasma. Panels II and IV correspond to the insets drawn in panels I and II, respectively. EVs are round shaped and delimited by a lipid bilayer. Moreover, smaller electron dense particles (~25 nm) lacking a visible lipid membrane are observed (black arrows), indicating the presence of contaminants such as VLDL or LDL. Scale bar denotes 100 nm. (d) Representative flow cytometry dot-plot for unstained medium/large size EVs isolated from platelet-free plasma within the working gate (in blue). The gate was defined using the violet side scatter (Violet-SSC) against the regular SSC, using calibrated beads of sizes ranging from 0.25 to 1.34 µm as explained in ). (e) Representative dot-plots for gated EVs confronting the fluorescence intensity for FITC vs. APC. Processing of CFSE in EVs gives a positive signal in the FITC channel. Left panel shows no fluorescent signal in unstained EVs, while 80% of CFSE stained EVs are FITC positive (right panel).
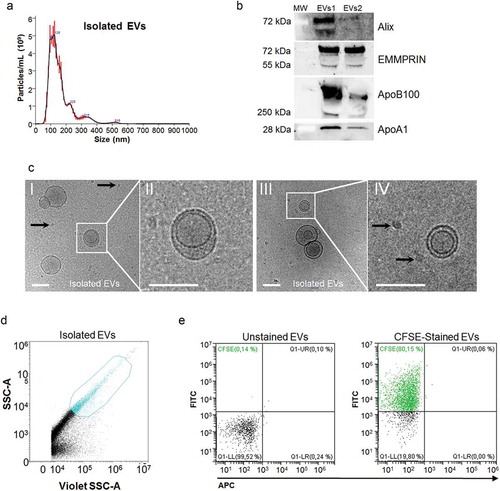
Figure 3. Downstream analysis of differential expression results in EVs. (a) Schematic overview of EVs isolation by high-speed centrifugation from platelet-free plasma. Poly-A transcripts were captured using magnetic beads and scRNA-Seq libraries were generated following an adapted protocol from Jaitin et al, [Citation16]. Libraries were sequenced (Illumina NextSeq 500) and data questioned with an optimized bioinformatics workflow for data pre-processing and analysis. (b) Volcano plots showing the differentially expressed genes of the contrasts performed by LimmaVoom. In red, genes with a fold-change (log2) and p-value higher than 1.5 and 0.01, respectively. In green, genes that show differential expression in the CLI vs control contrast. (c) Hierarchical clustering (Euclidean distance) and heatmap imaging of the 15 differentially expressed genes in control and PAD patients (n = 12/group). Samples are arranged in columns (control in green, IC in orange and CLI in pink) and genes in rows. Up-regulated expression is shown in red and downregulated expression in blue. The heatmap was generated using counts per million expression values (CPM, logarithmically transformed) after adjustment for batch, sex and age. (d) mdGSA function enrichment network visualization by Cytoscape. Upregulated gene-sets (Gene Ontologies) for two contrasts are shown; IC vs. control in orange, and CLI vs. control in blue. Nodes size is proportional to number of genes, and edge thickness to degree of similarity between nodes.
![Figure 3. Downstream analysis of differential expression results in EVs. (a) Schematic overview of EVs isolation by high-speed centrifugation from platelet-free plasma. Poly-A transcripts were captured using magnetic beads and scRNA-Seq libraries were generated following an adapted protocol from Jaitin et al, [Citation16]. Libraries were sequenced (Illumina NextSeq 500) and data questioned with an optimized bioinformatics workflow for data pre-processing and analysis. (b) Volcano plots showing the differentially expressed genes of the contrasts performed by LimmaVoom. In red, genes with a fold-change (log2) and p-value higher than 1.5 and 0.01, respectively. In green, genes that show differential expression in the CLI vs control contrast. (c) Hierarchical clustering (Euclidean distance) and heatmap imaging of the 15 differentially expressed genes in control and PAD patients (n = 12/group). Samples are arranged in columns (control in green, IC in orange and CLI in pink) and genes in rows. Up-regulated expression is shown in red and downregulated expression in blue. The heatmap was generated using counts per million expression values (CPM, logarithmically transformed) after adjustment for batch, sex and age. (d) mdGSA function enrichment network visualization by Cytoscape. Upregulated gene-sets (Gene Ontologies) for two contrasts are shown; IC vs. control in orange, and CLI vs. control in blue. Nodes size is proportional to number of genes, and edge thickness to degree of similarity between nodes.](/cms/asset/f2fb4614-e4e3-478a-a3ca-32e9657d28f5/zjev_a_1729646_f0003_oc.jpg)
Table 2. Differentially expressed genes after transcriptomic analysis of circulating EVs. Controls (Ctrl, n = 12), intermittent claudication (IC, n = 12) and critical limb ischaemia (CLI, n = 12).
Figure 4. S100A9 mRNA expression and calprotectin levels in circulating EVs and serum of control and PAD patients. (a) The association between the mRNA levels of S100A9 in EVs measured by RNA-Seq (Y axis, log-transformed), and the serum levels of calprotectin (X axis, log-transformed) determined by ELISA in the same subjects, showed a positive significant correlation between them (n = 35, r = 0.337, p = 0.048). (b, c) Serum calprotectin levels were measured by ELISA in the complete PAD population (n = 317). Increased levels of calprotectin were observed in PAD patients with amputation (b) and MACE1 (c) in the follow-up (mean follow-up 3.6 years). *p < 0.05 and **p < 0.001 vs. no event. (d, e) Kaplan-Meier curves for the incidence of amputation (d) and MACE1 (e) in the follow-up. PAD patients were categorized according to the combination of calprotectin (≥7.4 µg/mL) and hs-CRP levels (≥13 mg/L). Group 1: low calprotectin and low hs-CRP; Group 2: either high calprotectin or high hs-CRP, and Group 3: high calprotectin & high hs-CRP. Patients with high levels of calprotectin and hs-CRP (group 3) presented increased risk for amputation and MACE1 than those within groups 1 and 2.
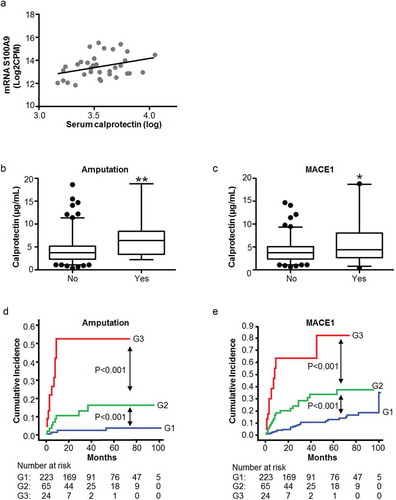
Table 3. Competing risk analyses (Fine-Gray model) for calprotectin and hs-CRP, and amputation and MACE1 in PAD patients (n = 317).
Table 4. Competing risk analyses (Fine-Gray model) for categorized calprotectin and hs-CRP, and amputation and MACE1 in PAD patients (n = 317).
Figure 5. S100A9 expression on human femoral EVs and arterial tissue. (a) S100A9 mRNA was detected by RT-qPCR in EVs from conditioned medium of human femoral atherosclerotic plaques ex vivo (n = 3), and locally in femoral atherosclerotic tissues (n = 3). EVs were pretreated with proteinase K and RNase before RNA isolation to eliminate possible RNA contaminants from non-EVs sources. Data are presented as Ct values. (b, c) Representative western blots for S100A9 in EVs from femoral plaques (panel b, n = 2) and in atherosclerotic femoral tissue (panel c, n = 3). We were able to detect the monomers of S100A9 (≈14 kDa, black arrow), and also found bands at higher sizes (≈24 to 70 kDa) corresponding to the heterodimeric, trimeric or tetrameric forms of S100A9.
