Figures & data
Figure 1. Imaging of different EV subpopulations. (a) Atomic Force Microscopy (AFM) topography image of the large EV (LEVs), medium EV (MEVs) and small EV (SEVs) preparations adsorbed onto mica (scale bars as indicated; colorimetric scale indicates the maximum height detected in each image). (b) Size distribution obtained from analysis of AFM images such as in (a). A total of 513 (TRAMP), 433 (B16) objects were analysed for LEVs, more than 2000 objects for MEVs and SEVs. Numbers on graphs indicate the diameter, in nm, of each peak indicated for LEVs, MEVs and SEVs from TRAMP and B16, respectively.
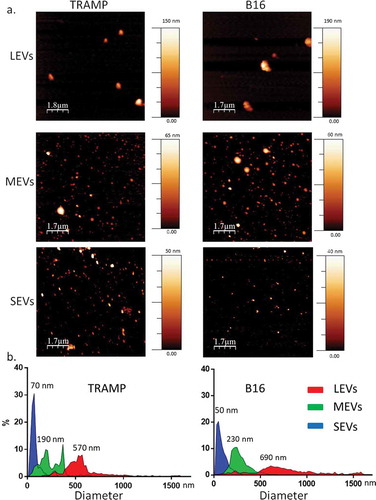
Figure 2. (a) EV populations purity assessment from protein contaminants with CONAN assay. Normalized Aggregation Index (AI) of AuNPs (disperse gold nanoparticles), AuNPs + PBS (aggregated gold nanoparticles), Large EVs (LEVs), Medium EVs (MEVs), Small EVs (SEVs) are showed in the graph. AI decreases along with the change of the solution colour from red to blue (as indicated by the colour scale), and is inversely proportional to the preparation purity. (b) LEV, MEV and SEV biochemical characterization with Western Blot (WB) analysis. Equal volume (20 µL) of LEVs, MEVs, SEVs, 30 µg of cell homogenate (H) both for TRAMP and B16 were loaded. Samples were electrophoresed on SDS-PAGE gel and analysed for the antibodies described in the figures. Un-cropped WB is available in the Supplemental Material.
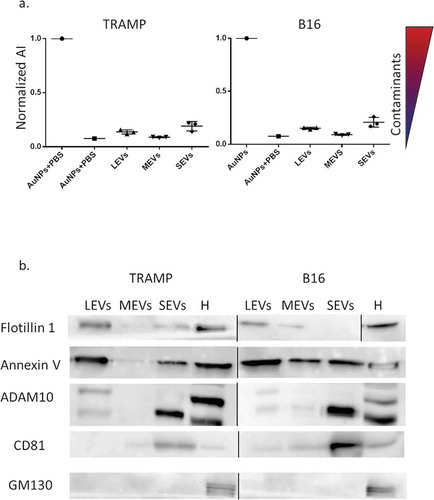
Figure 3. Representative FT-IR spectra of LEVs (red curve), MEVs (green curve), and SEVs (blue curve) derived from (a) TRAMP cell line, and (b) B16 cell line. Characteristic absorption bands of lipids and proteins are highlighted in the plots. Peaks at 2940 cm−1 and 2860 cm−1 correspond to the absorption of the lipid acyl chains. The amide I absorption band, around 1650 cm−1, is due to the carbonyl stretching vibration, and the amide II absorption band, around 1540 cm−1, is due primarily to N-H bending vibrations. Peak at 1740 cm−1 is characterized by the absorption of the ester carbonyl groups.
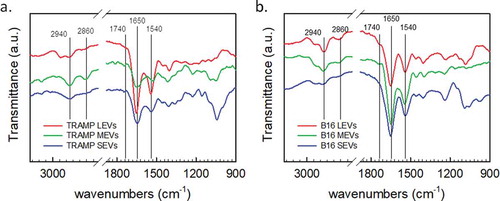
Figure 4. PCA analysis of the different EV subpopulations derived from TRAMP and B16 cell line visualized in Score plot. Left panels display the schemes of the datasets used to derived the principal components (a, TRAMP EV subpopulations, orange arrow; c, B16 EV subpopulations, light blue arrow). Score plots of the different EV subpopulations are showed in the right panels (b, TRAMP EV subpopulations; d, B16 EV subpopulations). LEVs are depicted in red circles, MEVs in green circles and SEVs in blue circles. Each colour-coded symbol indicates the average of three technical replicates of a biological replicate.
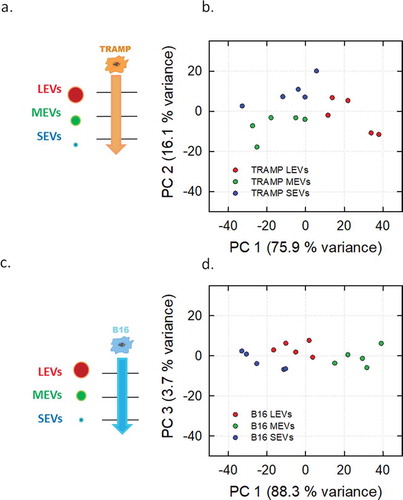
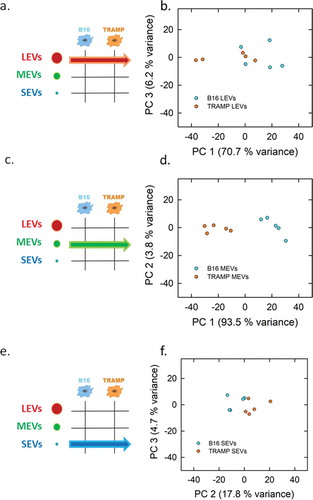
Figure 5. PCA analysis of the LEVs, MEVs and SEVs derived from TRAMP and B16 cell line visualized in Score plot. Left panels display the schemes of the datasets used to derived the principal components (a, LEVs from TRAMP and B16 cell lines; c, MEVs from TRAMP and B16 cell lines; e, SEVs from TRAMP and B16 cell lines). Score plots of LEVs (b), MEVs (d), SEVs (f) from TRAMP and B16 cell line are showed in the right panels. Each colour-coded symbol indicates the average of three technical replicates of a biological replicate (B16 in light blue circles, and TRAMP in orange circles).