
Figures & data
Figure 1. Study design.
(a): The isolation and purification of plasma EVs. (b): TMT-labelled LC-MS/MS analysis of samples from cohort 1. (c): Validation of 4 candidate biomarkers in cohort 2. Validation of FGA in cohort 3, mouse tumour model and CRC cell lines. (d): FGA+ crEV detected by fast DIA-MS and validated by PRM-MS in cohort 4.
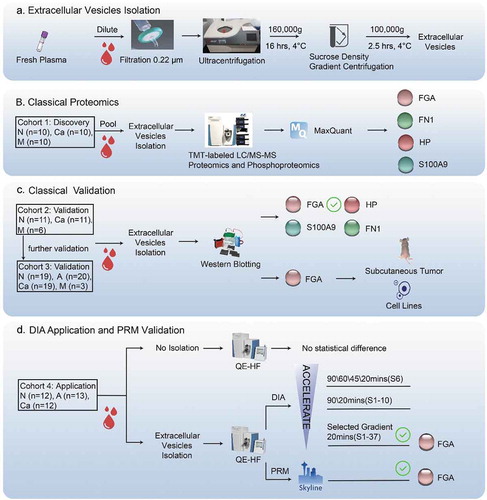
Figure 2. Characterization of plasma-derived EVs enriched from healthy donors and patients with CRC.
(a). Representative TEM images of purified EVs. Scale bar – 200 nm. (b). Immunoblots showing expression levels of CD63, HSP70, TSG101 and Calnexin in the purified EVs. N – healthy individuals, Ca – CRC patients without liver metastases, and M – CRC patients with liver metastases. (c). Particle size distribution of EVs measured by Nano sight.
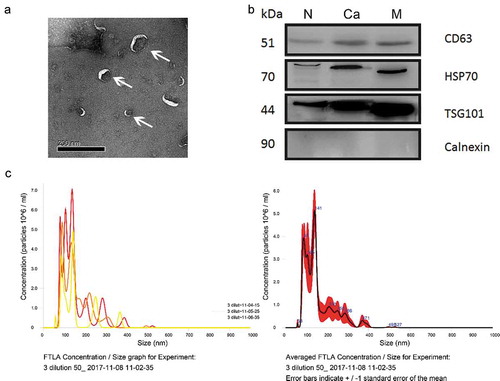
Figure 3. Proteomics and phosphoproteomics analyses of EVs.
(a) Cluster analysis of differentially expressed and phosphorylated EV proteins (fold change > 1.5, t-test p-value<0.05). (b) Volcano Plot comparing up-regulated and down-regulated proteins across different groups. N – healthy individuals, Ca – CRC patients without liver metastasis, and M – CRC patients with liver metastases (fold change > 1.3, t-test p-value<0.05). The orange points indicate FGA, FN1, HP and S100A9 with significantly different expression levels. (c) Immunoblots showing expression levels of EV’s FGA, FN1, HP and S100A9 in the N (n = 4), Ca (n = 4) and M (n = 2) groups (upper panel), and in the mouse model transplanted with SW620 (n = 5; left) and LoVo (n = 4; right) cells (lower panel). (d) Relative abundance of total and phosphorylated proteins in different groups. (e) The pre-treatment fibrinogen (FIB) values obtained from the clinical data (coagulation function) of cohorts 1, 2 and 3 (p > 0.05).
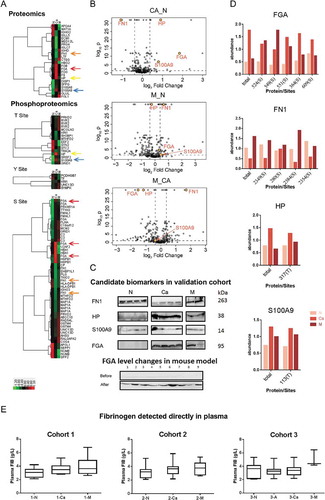
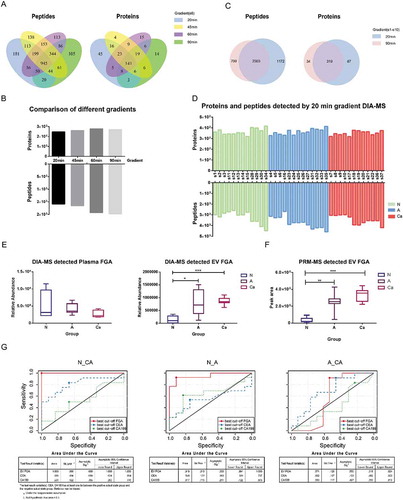
Figure 4. Clinical validation of DIA-MS and PRM-MS.
(a, b) Number of peptides and proteins identified in sample S6 in cohort 4 when analysed by DIA methods with four different LC gradient lengths. (c) Comparison of peptides/proteins observed in 10 samples analysed by 20 and 90 min LC gradients. (d) The number of peptides and protein groups identified in each sample with an LC gradient of 20 min. (e) Relative abundance of FGA in the plasma and crEV samples from adenoma patients (group A, n = 6 and 13), CRC patients (group Ca, n = 7 and 12) and healthy individuals (group N, n = 6 and 12). *p = 8.99e-005, ***p = 8.84e-012.(f) Fragment Total Area of FGA detected by PRM (group A, n = 13), CRC patients (group Ca, n = 12) and healthy individuals (group N, n = 12). **p = 8.83e-007, ***p = 2.67e-012. The sequences of the peptides we used for quantification are DSHSLTTNIMEILR and QFTSSTSYNR. (g) ROC curves comparing the diagnostic power of FGA+ crEV (solid red line), serum CEA levels (dotted blue line) and serum CA19-9 levels (dotted green line) between the N/Ca, N/A and A/Ca groups. Solid black line is the reference line.
Supplemental material