Figures & data
Scheme 1. Schematic illustration of therapeutic sEVs released from Gelma/nanoclay hydrogel for cartilage regeneration. (a) Preparation of Gelma/nanoclay/sEVs hydrogel and cartilage defect implantation. (b) Sustained release of sEVs with the degradation of hydrogel. (c) Internalization of therapeutic sEVs by chondrocytes and hBMSCs. (d) The effect of sEVs on chondrocytes and hBMSCs. (e) Regeneration of cartilage defect by the composited hydrogel.
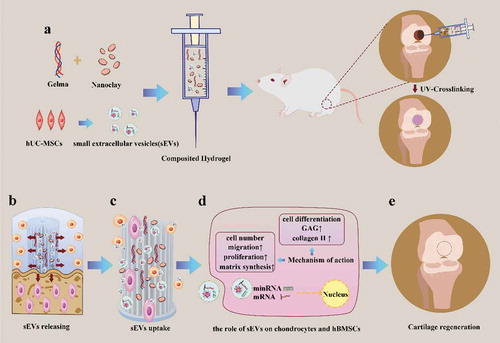
Figure 1. Identification of hUC-MSCs and hUC-MSCs-sEVs. (a) Representative images showing the spindle-like morphology of hUC-MSCs. Scale bar: 100 um. (b) Characteristic surface markers of hUC-MSCs evaluated by flow cytometry. The blue curves represent isotype controls and the red curves represent the surface markers. (c) Morphology of hUC-MSCs-sEVs visualized under transmission electron microscopy (TEM). Scale bar: 200 nm. (d) Particle size distribution of hUC-MSCs-sEVs measured using nanoparticle tracking analysis. (e) Surface markers of hUC-MSCs-sEVs quantified by western blotting.
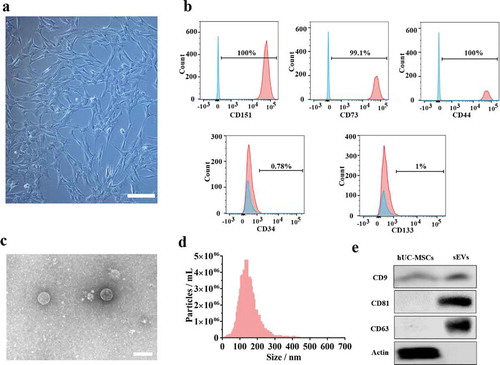
Figure 2. hUC-MSCs-sEVs promoted the migration, proliferation and differentiation of chondrocytes. (a) Representative fluorescence micrograph of PKH-26 (red)-labelled sEVs internalized by primary chondrocytes. The labelled sEVs were co-incubated with chondrocytes for 24 h. Scale bar:20um. (b) Effect of hUC-MSCs-sEVs on viability of chondrocytes. CCK-8 values were measured at 24 h after co-incubation **P < 0.01. (c) Representative images showing the transwell migration assay of chondrocytes treated with sEVs for 8 h. Scale bar: 50 um. (d) Quantitative analysis of the migrated chondrocytes cultured in different concentrations of sEVs. **P < 0.01, ***P < 0.001. (e) Alcian blue staining of chondrocytes treated with sEVs for 7 days. (f) Quantitative analysis of alcian blue staining. (g) The protein levels of aggrecan and collagen II in chondrocytes were analysed by western blotting. (h), (i) and (j) RNA expression levels of Aggrecan, Col2, Sox9 were measured by qPCR. **P < 0.01, ***P < 0.001. For viability assay, transwell migration assay and qPCR, group control, sEVs1 and sEVs2 indicated 0, 5 and 10 × 108 particles/mL sEVs, respectively. Data were presented as mean ± SD of three number of replicates. t-test was applied to each group in order to compare mean beta values.
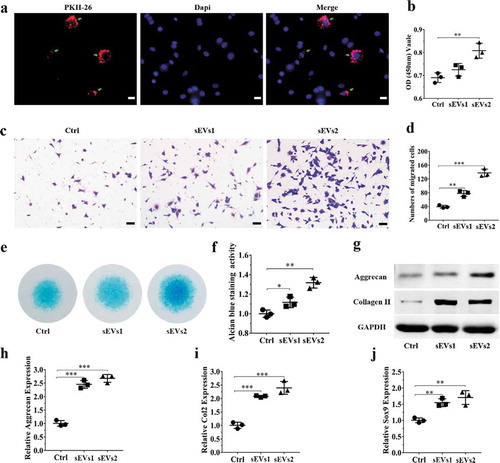
Figure 3. hUC-MSCs-sEVs promoted the migration, proliferation and differentiation of hBMSCs. (a) Representative fluorescence micrograph of PKH-26 (red)-labelled hUC-MSCs-sEVs internalized by hBMSCs. The labelled sEVs were co-incubated with hBMSCs for 24 h. Scale bar: 20 um. (b) Effect of hUC-MSCs-sEVs on viability of hBMSCs. CCK-8 values was measured at 24 h after co-incubation. **P < 0.01, ***P < 0.001. (c) Representative images of transwell migration assay of hBMSCs treated with sEVs for 8 h. Scale bar: 50um. (d) Quantitative analysis of the migrated hBMSCs cultured in different concentrations of sEVs. *P < 0.05, **P < 0.01. (e) and (f) Representative micrograph of hBMSCs microspheres and the statistical results. The cell microspheres with sEVs treatment for 21 days. (g) Alcian blue stained sections of hBMSCs microspheres. (h) Quantitative analysis of alcian blue stained sections of hBMSCs microspheres. (i) The protein levels of aggrecan and collagen II in hBMSCs were analysed by western blotting. (j) Gene expression levels of Aggrecan, Col2 and Sox9 were measured by qPCR, the statistical results analysis was also showed. *P < 0.05, **P < 0.01, ***P < 0.001. For viability assay, transwell migration assay, and qPCR, group Ctrl, sEVs1 and sEVs2 indicated 0, 5 and 10 × 108 particles/mL sEVs, respectively, and data were presented as mean ± SD of three number of replicates. t-test was applied to each group in order to compare mean beta values.
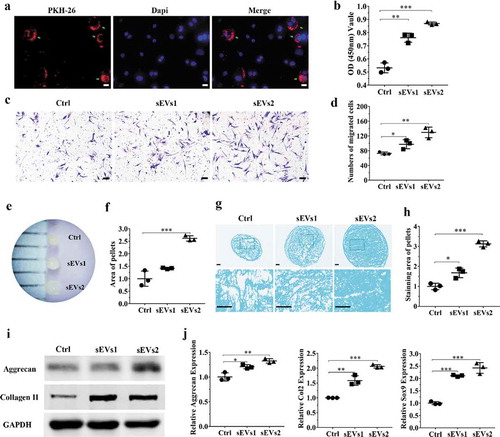
Figure 4. hUC-MSCs-sEVs activated the PTEN/AKT signalling pathway by delivering miR-23a-3p. (a) Normalized miRNA expression levels measured by miRNA microarray. (b) Normalized chondrogenesis-related miRNA expression levels and gene expression level of miR-23a-3p. (c) The potential target sequences of miR-23a-3p were predicted by bioinformatic analysis. (d) 293 T cells were transfected with luciferase reporter plasmids WT or MUT 3ʹ-UTR of PTEN and miR-23a-3p, luciferase activity was detected by Dual-Luciferase Reporter Assay System. Data were presented as mean ± SD of three number of replicates. **P < 0.01. (e) Chondrocytes were transfected miR-23a-3p for 24 h, then the expression of miR-23a-3p in chondrocytes was measured by qPCR. Data were presented as mean ± SD of three number of replicates. t-test was applied to each group in order to compare mean beta values. ***P < 0.001. (f) The protein levels of AKT, P-AKT, PTEN in chondrocytes were quantified using western blotting.
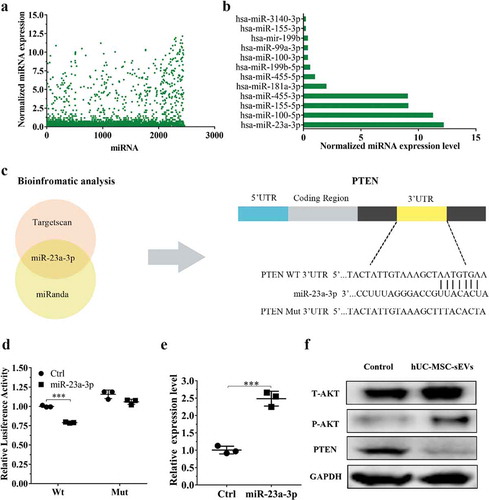
Figure 5. miR-23a-3p silencing attenuated the effect of hUC-MSCs-sEVs in chondrocytes. (a) Chondrocytes treated with antagomir-23a-3p or scramblemir (Ctrl) for 6 h, and the expression of miR-23a-3p was measured by qPCR. The results of statistical of three independent replicates are shown. ***P < 0.001. (b) Viability of chondrocytes treated with antagomir-23a-3p and hUC-MSCs-sEVs. Group ant-mir-23a represented the treatment of antagomir-23a-3p and hUC-MSCs-sEVs (10 × 108 particles/mL), Group Ctrl and sEVs2 represented scramblemir and 10 × 108 particles/mL hUC-MSCs-sEVs, respectively. Data were presented as mean ± SD of three number of replicates. **P < 0.01 (c) Representative images of transwell migration assay of chondrocytes. Scale bar: 50um. Group ant-mir-23a represented the treatment of antagomir-23a-3p and hUC-MSCs-sEVs (10 × 108 particles/mL), Group Ctrl and sEVs2 represented scramblemir and 10 × 108 particles/mL hUC-MSCs-sEVs, respectively. (d) Quantitative analysis of the migrated chondrocytes. **P < 0.01. Data were presented as mean ± SD of three number of replicates (e) Alcian blue staining of chondrocytes. (f) RNA expression levels of Sox9, Col2, Aggrecan were measured by qPCR. *P < 0.05. Data were presented as mean ± SD of three number of replicates. *P < 0.05.(g) The protein levels of AKT, P-AKT, PTEN in chondrocytes were analysed by western blotting.
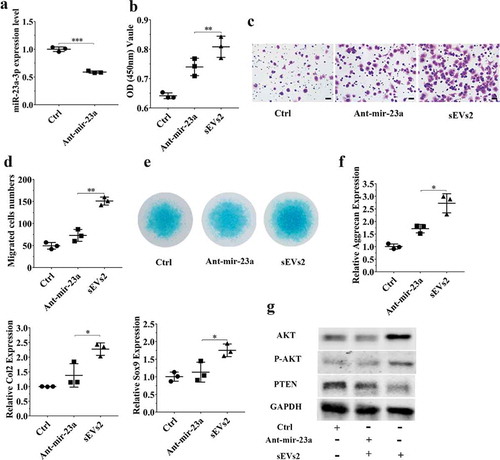
Figure 6. miR-23a-3p silencing attenuated the effect of hUC-MSCs-sEVs in hBMSCs. (a) hBMSCs treated with antagomir-23a-3p or scramblemir (Ctrl) for 6 h, and the expression of miR-23a-3p was measured by qPCR. The results of statistical of three independent replicates are shown. ***P < 0.001. (b) Viability of hBMSCs treated with antagomir-23a-3p and hUC-MSCs-sEVs. Group ant-mir-23a represented the treatment of antagomir-23a-3p and hUC-MSCs-sEVs (10 × 108 particles/mL), Group Ctrl and sEVs2 represented scramblemir and 10 × 108 particles/mL hUC-MSCs-sEVs. Data were presented as mean ± SD of three number of replicates. **P < 0.01 (c) Representative images of transwell migration assay of hBMSCs. Scale bar: 50um. Group ant-mir-23a represented the treatment of antagomir-23a-3p and hUC-MSCs-sEVs (10 × 108 particles/mL), Group Ctrl and sEVs2 represented scramblemir and 10 × 108 particles/mL hUC-MSCs-sEVs. (d) Quantitative analysis of the migrated hBMSCs. **P < 0.01. Data were presented as mean ± SD of three number of replicates (e) Alcian blue staining of hBMSCs. Group ant-mir-23a represented the treatment of antagomir-23a-3p and hUC-MSCs-sEVs (10 × 108 particles/mL), Group Ctrl and sEVs2 represented scramblemir and 10 × 108 particles/mL hUC-MSCs-sEVs. (f) RNA expression levels of Sox9, Col2, Aggrecan were measured by qPCR. *P < 0.05. Data were presented as mean ± SD of three number of replicates. *P < 0.05. (g) The protein levels of AKT, P-AKT, PTEN in hBMSCs were analysed by western blotting.
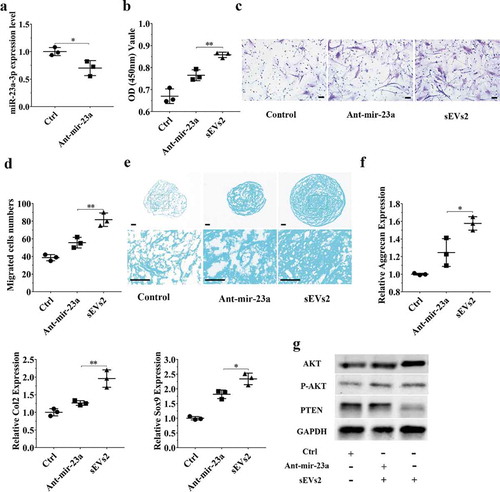
Figure 7. Characterization of Gelma hydrogel, Gelma/Geltain hydrogel and Gelma/nanoclay hydrogel. (a) Scanning electron micrographs of Gelma, Gelma/Geltain and Gelma/nanoclay hydrogels. Scale bars, 200 μm. (b) Profile of sEVs released from the hydrogels. (c) Rheological properties of the hydrogels. (d) Swelling ratio of the hydrogels in PBS (pH 7.2) at 37°C. (e) Degradation ratio and mechanical properties (f) the hydrogels. For mechanical properties analysis, data were presented as mean ± SD of three number of replicates. t-test was applied to each group in order to compare mean beta values. ***P < 0.001.
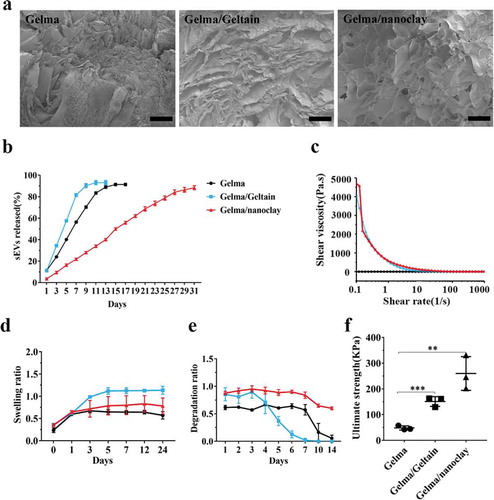
Figure 8. Histological evaluation of cartilage defect repaired by Gel-nano-sEVs hydrogel. (a) Macroscopic observation of cartilage defect at 12 weeks postsurgery. (b) ICRS macroscopic scores of different groups. Data were presented as mean ± SD of three number of replicates. t-test was applied to each group in order to compare mean beta values. n = 6, ***P < 0.001. (c) Safranin O/fast green staining of repaired cartilage. Scale bar = 250 um. (d) HE staining of repaired cartilage. Scale bar = 250 um. (e) Immunohistochemical staining of collagen II. Scale bar = 125 um. (f) Quantitative analysis of immunohistochemical staining of collagen II. (g) ICRS visual histological scores of different groups. Data were presented as mean ± SD of three number of replicates. t-test was applied to each group in order to compare mean beta values. n = 6, ***P < 0.001.
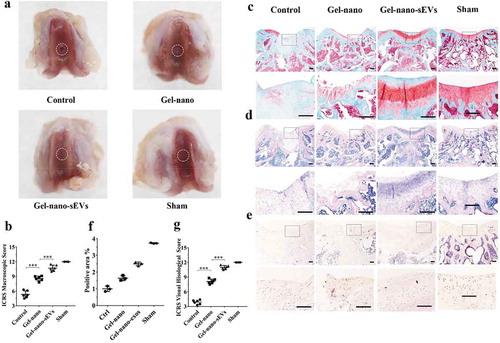
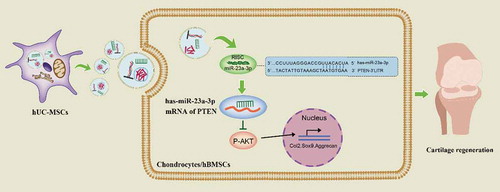
Figure 9. Underlying mechanism of hUC-MSCs-sEVs on cartilage regeneration.