Figures & data
Figure 1. Characterisation of PANC-1, B16-F10 and HEK-293 Exosomes (Exo). (a) Size distributions of PANC-1, B16-F10 and HEK-293 Exo obtained by Nanoparticle Tracking Analysis (NTA) using a NanoSight LM-10. The histograms indicate a similar size distribution profile for all the three exosomes. (b) Morphology characterisation by transmission electron microscopy (TEM) and scanning electron microscopy (SEM). Scale bar: 50 nm. (c) Detection of tetraspanins CD9, CD63 and CD81 on exosomes using flow cytometry. Exosomes were coupled to aldehyde/sulphate latex beads prior to detection. Exo-beads complex were subsequently stained using a 2-step labelling (anti-CD9, anti-CD63 or anti-CD81 1° Ab/Cy5-conjugated 2° Ab). Degree of expression of the markers are expressed as the fold increase in mean fluorescence intensity (MFI) values to Exo-beads complex stained with Cy5-conjugated 2° Ab, where an MFI ratio of 2 was set as the threshold for positive expression. (d) Detection of “do-not-eat-me” marker CD47 on PANC-1, B16-F10 and HEK-293 Exo. A MFI ratio of 2 was set as the threshold for positive expression. Values are expressed as mean ± SD (n = 3). Statistical analysis were only conducted on human exosomes. *p < 0.05, ***p < 0.001, ns: No significance. (e) Dot blots for detection of luminal exosomal markers. Equal amounts of protein (0.5 μg in 40 μL) from the Exo and cell lysate samples for each cell line were spotted on nitrocellulose membranes. The membranes were then blocked with 3% milk, and stained using a 2-step labelling (anti-Alix, anti-TSG101 or anti-CANX 1° Ab/HRP-conjugated 2° Ab).
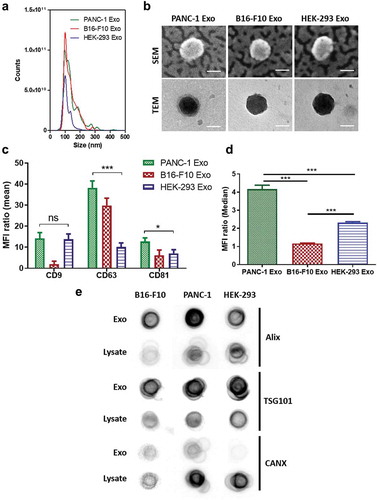
Table 1. Physicochemical characterisation of exosomes.
Table 2. Comparison of exosome purification methods post-labelling.
Figure 2. Clickable surface fluorescence labelling of exosomes and their characterisation. (a) Scheme of the fluorescence labelling method of exosome surface using copper-free click chemistry with AlexaFlour®488 (AF488)-azide. (b) Elution profiles (fractions 0–8 (F0–F8)) of labelled Exo or free dye using gel filtration with CL-2B column for purification. (c) NTA analysis of all the fractions from elution of both free dye and labelled Exo. Labelled Exo are collected from F1–F2. (d) Labelling confirmation by flow cytometry analysis of labelled Exo. Labelled and unlabelled Exo were conjugated to latex microbeads prior to analysis under the FL1 channel for detection of AF488 signals.
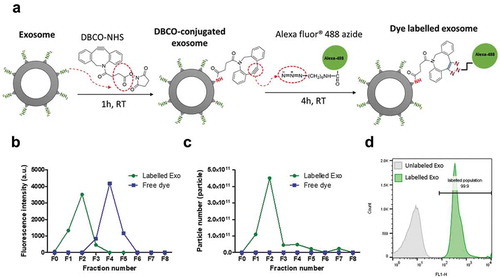
Figure 3. Design of experiments (DoE)-driven modelling of exosome cellular uptake. D-optimal design was established to combine four varied factors (exosome type, cell type, time and dose) at different levels to investigate the effects of individual factor or 2-factor interactions on the exosome cellular uptake. (a) Input information for establishing D-optimal Design using MODDE software. (b) Assessing the prediction power of the model in a plot of predicted vs. observed (with 1–1 line in black dashed line). Statistical parameters of the DoE model for Taken-up particle number and %Uptake modelling are summarised below the fitted data. (c) Contour plots relating the effect of incubation time and Exo dose on Taken-up particle number (left) and %Uptake (right) for PANC-1, B16-F10, HEK-293 Exo in PANC-1 cells. The red and darkest blue colour indicate the highest and lowest responses, respectively.
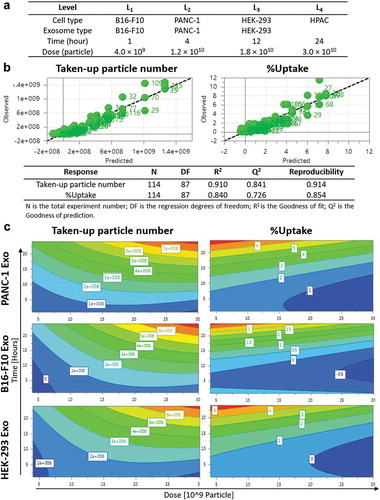
Figure 4. Effect of incubation time and exosome dose on in vitro exosome uptake in PANC-1 cells by imaging flow cytometry. (a) Time-dependent uptake profile of the three exosome types in PANC-1 cells. Each cell simultaneously imaged using the Imagestream Cytometer under the bright field and fluorescence (AF488) channels after incubation with labelled Exo for 1, 4, 12 and 24 h at a fixed dose of 2.0 × 10¹⁰ particles (sub-saturation level). Uptake was measured as the mean AF488 signal per cell, normalised according to the difference in labelling efficiency of the three exosomes. The error bars represent the s.e.m. (n > 2000 for all data). (b) Dose-dependent uptake profiles of the three exosome types in PANC-1 cells. PANC-1 cells were treated with each exosome at a dose of 4 × 10⁹, 1.2 × 10¹⁰, 2.0 × 10¹⁰, 2.8 × 10¹⁰, 3.6 × 10¹⁰ particles for 24 h. Uptake was measured as the taken-up particle number per cell. Values are presented as mean ± SD (n = 3). Statistical analysis was done for the two longest incubation times in (a), and the highest dose for (b).
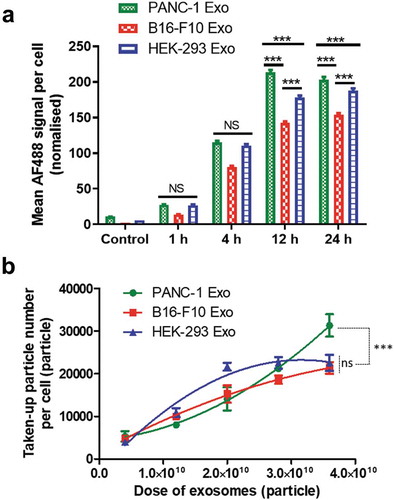
Figure 5. Spatial distribution analysis of Exo in PANC-1 cells by confocal laser scanning microscopy (CLSM). PANC-1 cells were seeded at 30 K per well in a 24-well plate overnight. Cells were then fixed, nuclei were counter-stained with DAPI (blue), F-actin were stained with AF568 phalloidin (red). (a) PANC-1 cells incubated with AF488-labelled PANC-1 Exo (green) at 2.0 × 10¹⁰ particles per well for 1, 4, 12 and 24 h at 37°C. In a separate experiment, acidic organelles (e.g. lysosomes, late endosomes) were stained with LysoTracker Red DND-99 (577/590 nm) (red). (b) PANC-1 cells incubated with B16-F10 Exo (left) or HEK-293 Exo (right) at 2.0 × 10¹⁰ particles per well for 24 h at 37°C. Scale bar: 20 µm.
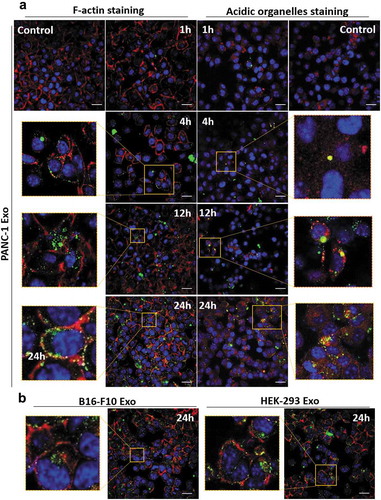
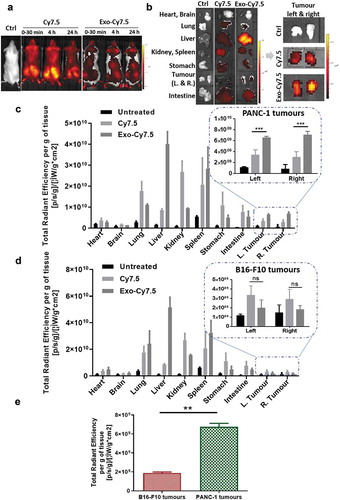
Figure 6. In vivo organ biodistribution profile of PANC-1 Exo in tumour-bearing NSG mice. Mice were inoculated subcutaneously with PANC-1 cells or B16–F10 cells in bilateral flanks (two tumours per mouse). Animals were intravenously injected with 200 µL containing PANC-1 Exo-Cy7.5 (approximately 8 × 10¹¹ particles and 8.3 pmol of dye), Cy7.5 (approximately 8.3 pmol) or saline. Animals were killed at 24 h post-injection and the organs were excised for analysis. (a) Whole body live imaging, (b) ex vivo imaging and (c) organ biodistribution profiles of PANC-1 Exo in PANC-1 tumour-bearing mice. (d) Organ biodistribution profiles of PANC-1 Exo in B16–F10 tumour-bearing mice. For (c) and (d), Inset: zoomed-in tumour accumulation profile of PANC-1 Exo. (e) Comparison of PANC-1 Exo accumulation in PANC-1 vs B16–F10 tumours. Values were normalised to organ weight and expressed as mean ± SD (n = 3). Statistical analysis was done on tumour accumulation values. (ns: no significance, **p < 0.01, ***p < 0.001).