Figures & data
Figure 1. Detection of endogenous protein markers on EVs released from 293T cells. (a) Non-reducing SDS-Page transferred to nitrocellulose of mCherry positive 293T cell lysate or S15Ch concentrated extracellular vesicles (EVs) by ultracentrifugation with or without the addition of.1% SDS before the concentration. Nitrocellulose was probed with antibodies against mCherry (band shown at ~30kDA), CD9 (band shown at ~25 kDA), CD63 (centre of band shown at ~50kDA), CD81 (band shown at ~22 kDA), and GAPDH (band shown at ~37 kDA). (b) Representative transmission electron microscopy images of concentrated S15Ch EVs showing primary antibodies against CD63 and CD81, respectively, and secondary anti-mouse conjugated to 20 nm gold particles. (c) Representative z stack of EVs from S15Ch 293T cells spinoculated onto a coverslip. The individual mCherry, CD63, and LAMP1 channels are shown, with a merge. (d) Panel of representative 3D maximum intensity projection reconstruction from z stack images demonstrating the S15Ch (S15Ch, red) channel alone (top) as well as the S15Ch signal with the spots masking algorithm generated in Bitplane Imaris imaging software (bottom). (e) Spots masking algorithm in (d) was used to calculate the percent of S15Ch EVs positive for the indicated proteins. XY co-localization plots of S15Ch spots and the maximum intensity of the mouse anti-tetraspanin (CD9, CD63, CD81) or their secondary antibody as a control on the X-axis and the maximum intensity of the rabbit ant-LAMP1 antibody or its secondary antibody as a control. identical staining in the absence of primary antibody was performed. XY graphs show co-localization from a single 3D reconstructed image. Green and Blue lines show the value determined to be above background based on the secondary antibody only controls. (f) Graphs show mean co-localization percent of each of the antibody staining paradigms indicated in (e) from a single coverslip where 20 z-stack images were taken. + (positive) and/or – (negative) reference the percent found from each quadrant of the co-localization plot; for example, S15Ch (+), CD81 (+), LAMP1 (+) references the top, right quadrant of the graph. Percentage of S15Ch spots described as positive or negative for each marker is indicated. Error bars display the mean and the standard deviation.
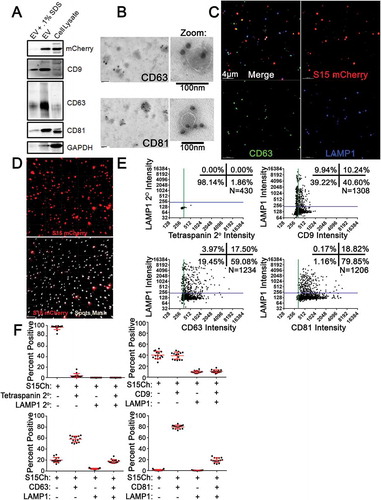
Figure 2. EV-MAC reproducibly stains EV populations following enrichment from tissue culture supernatant (a) Cultured media containing EVs were either left unconcentrated or concentrated via differential ultracentrifugation. The EVs were then stained with either CD9, CD63, CD81, in addition to LAMP1. Data show the mean value from three independently collected S15Ch 293T media preparations, where each of the media preparations were split among the four staining paradigms and spun onto a separate coverslip. 20 images were taken per coverslip. Error bars depict standard error of the mean. No significant differences were found among each respective staining paradigms among the unconcentrated and concentrated EVS when subjected to a two-way ANOVA with Tukey’s multiple comparison post-hoc test. (b) Data compares the mean value among three independent coverslips and media preparations for S15 mCherry co-localization as determined by either “each image measure” or “Pooled images measure. 20 images were taken per coverslip. All data shown was subjected to two-way ANOVA with Tukey’s multiple comparison post-hoc and found non-significant. All graphs depict error bars showing the mean with standard error of the mean.
Figure 3. Deconvolution does not change the co-localization distribution of S15Ch+ EVs with tetraspanins and LAMP1. (a) differential ultracentrifugation concentrated EVs from S15Ch 293T were spinoculated onto coverslips and subsequently stained with either CD9, CD63, CD81, in combination with LAMP1 or left unstained. Each condition was then subsequently stained with a mouse and rabbit secondary antibody. The secondary only control condition was used to determine the background fluorescence levels and the percent co-localization was determined for each image. Data shown is the mean value from three separate coverslips from independently collected media preparations. Within each preparation 15 images were taken per coverslip and the co-localization distribution was determined for each image and subsequently averaged to determine that samples co-localization. Data was found non-significant by one-way ANOVA when compared among the undeconvolved and deconvolved percent positive distribution of LAMP1 and tetraspanin, respectively. Error bars depict standard error of the mean. (b) Graphs show the relative number and percent difference of S15Ch spots as determined by the same spots masking algorithm from data collected in (a). Each replicate is an individual S15Ch EV sample preparation where a total of 45 images was taken among four coverslips. All data shows the mean value among replicates, error bars show the standard error of the mean. Significant differences between conditions were determined via two-tailed T-test. ***p < .001.
Figure 4. Analysis of EV recovery and quantification using EV-MAC. (a) Data shows the number of S15Ch puncta recovered as determined by EV-MAC workflow. The same algorithm was used for both poly L lysine and uncoated coverslips. (b) Sequential spinoculation of concentrated cultured media preparations where samples were first (1°) spinoculated and then samples were then re-spinoculated (2°) onto another coverslip. This was conducted for coverslips coated with poly L lysine. (c) Protein concentrations as determined by BCA for concentrated S15Ch EVs before and after spinoculation. The same initial (pre-Spinoculation) sample was used for both uncoated and poly L lysine coated coverslips, one of the poly L lysine wells was excluded due to pipetting error. (d) The co-localization of CD81 and LAMP1 was identified for S15Ch by the same spots masking algorithm for uncoated and poly L lysine coverslips to determine changes in EVs distribution, respectively. (e) The co-localization of CD81 and LAMP1 was identified for S15Ch by the same spots masking algorithm as (d) to determine changes in EVs distribution between the 1° and 2° spinoculation. Mean number of S15Ch spots detected in a 3D reconstructed image from serial dilutions of ultracentrifuge concentrated media preparations of S15Ch 293T EVs from three independent replicates (f). EVs were also stained for CD81 and mean number per image was also plotted (g). The same S15Ch spots algorithm and CD81 spots algorithm was applied for all dilutions and replicates (f, g) R2 shows the variance of a semilogarithmic line of best fit. (h, i) Graphs combine the replicates in (f, g) to show the mean number of S15Ch and CD81 spots per image from the last 4 and three dilutions, respectively. Data demonstrates a consistent measurable difference among the replicates. Replicates are defined as independent ultracentrifuge concentrated media preparations of S15Ch EVs from 293Ts that were spinoculated onto poly L lysine coated coverslips. 15 images were taken per serial dilution for each replicate. (a–e, h, i) All data shown is the mean percent of at three independent media preparations and coverslips. Significant differences between the number of (a, b) S15Ch spots were determined via two-tailed T-test. No significant differences in (d, e) co-localization among conditions were found as determined by two-way ANOVA. (a–i) All data shows the mean value among replicates, and error bars show standard error of the mean.
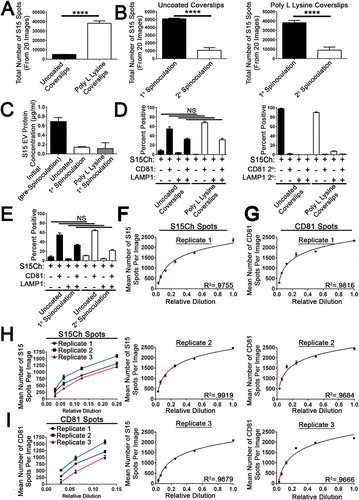
Figure 5. S15-mCherry THP-1 EVs co-localise with canonical EV markers at differing rates compared to 293T mCherry EVs. (a) S15Ch+ EVs from THP-1s were stained for the indicated tetraspanin and LAMP1. Data from 15–20 images were pooled together from a single coverslip. (b) The mean percentage of S15Ch+ EVs positive for each indicated marker from three independent media preparations and coverslips was calculated. Error Bars represent standard error of the mean. (c) Comparison of tetraspanin and LAMP1 staining on EVs released from THP-1 and 293T cells. Left panel shows the data compared based on co-localization plot quadrants while the second set of graphs shows the total percent of EVs positive for each individual stain, respectively. Data shown compares the percentage of positive EVs collected from the cultured media of S15Ch THP-1 and S15Ch 293T cells which were then subjected to our staining paradigms. The same masking algorithm was used to evaluate the S15Ch EVs from both cell lines. The data from the first column of graphs shown was subjected to two-way ANOVA with Tukey’s multiple comparison post-hoc. The data from the second column of graphs was subjected to Student’s Two-tailed T-test. All graphs shown depict mean value among three independent coverslips and media preparations and error bars show the standard error of the mean. *p < .05, **p < .01, ***p < .001.
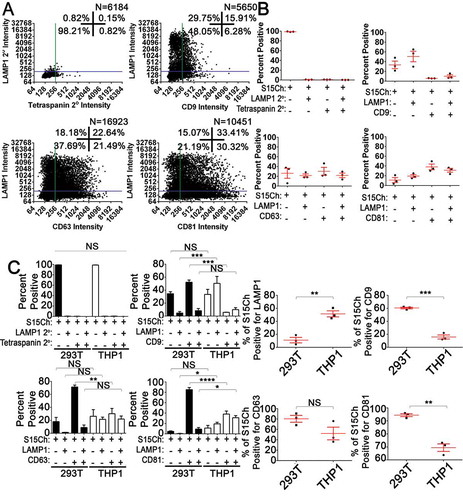
Figure 6. EVs containing different HIV-1 proteins exhibit differential tetraspanin and LAMP1 staining: The degree of co-localization of (a) TAT-GFP, (b) GFP-VPR, and (c) NEF-GFP EVs with tetraspanin markers, LAMP1 and TSG101. The data shown is the mean value from three independent media preparations and coverslips in which pooled data from a single coverslip was used to determine the mean co-localization percentages. Error bars show the standard error of the mean.
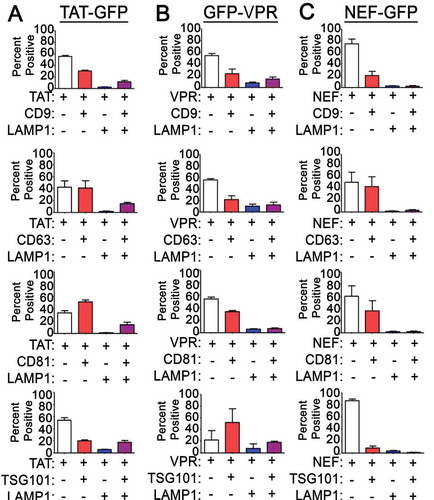
Figure 7. S15Ch+ EVs and Lectin co-localization is altered during lysosomal impairment. (a) The cultured media from S15Ch 293Ts was incubated with the indicated biotinylated lectins followed by Alexa 488 streptavidin to determine the glycan profile of EVs under both DMSO Vehicle (DMSO) and 100 nM Bafilomycin-A1 (BafA1) treated conditions. (b) Data shown is the mean percent co-localization summation of at least three independent media preparations and coverslips. Significant differences between control and BafA1 treated samples were determined via two-tailed T-test. *p < .05, **p < .01, ***p < .001.Error bars show standard error of the mean.
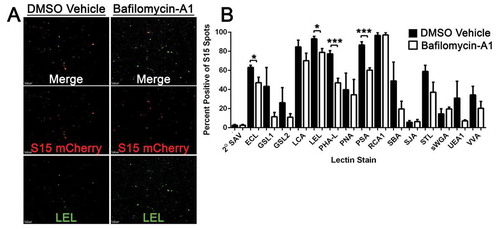
Figure 8. PKH Dyed WT 293T EVs co-localise with CD81, LAMP1, and readily identify S15Ch 293T EVs. Concentrated EVs from WT 293T cells or PBS were dyed with PKH26 (PKH Dye, green) at an initial dye concentration of 200 nM or 400 nM. (a) Representative z-stack from WT 293T EVs or PBS demonstrating co-localization of PKH Dye(green), CD81(red), and LAMP1(Blue) or its respective secondary antibody control. The dye labelled EVs were imaged and 3D reconstructions were used to identify dye positive EVs using the same spots masking algorithm for both dye concentrations to determine their co-localization with CD81 and LAMP1. (b, c) Representative co-localization from a 200 nM PKH dye image demonstrate relative co-localization. A total of three (d) and five (e) independent replicates were conducted for the 200 nM and 400 nM conditions, respectively. 10–15 images were taken per coverslip for each condition for each replicate. The number of EVs identified per image ranged from ~200–780. Concentrated S15Ch 293T EVs were either dyed with PKH67 (Dye) with an initial dye concentration of 200 nM or remained unstained. Both the undyed and dye labelled S15Ch EVs were then imaged, and 3D reconstructions were used to generate a spots masking algorithm around the dye positive (f) or S15Ch positive (g) EVs. (f) The percent of Dye+ EVs, as identified by its spots, demonstrate that the S15Ch could be reproducible found within the concentrated EVs. (g) The percent of S15Ch positive EVs, as identified by its spots algorithm, show their co-localization with the dyed EVs (left) are undyed EVs (right). three independent replicates were conducted. 10–15 images were taken per replicate. The number of identified Dye EVs per image ranged, from ~1100–1500; number of S15Ch identified EVs per image ranged, ~350–600. All data shows the mean value among replicates, error bars show the standard error of the mean.
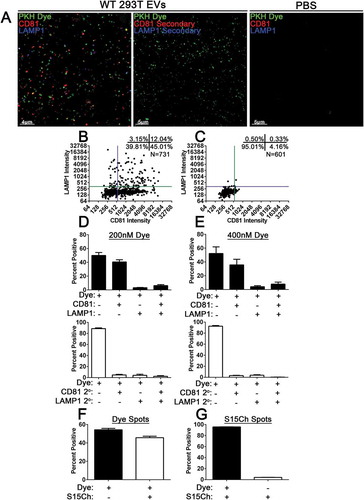
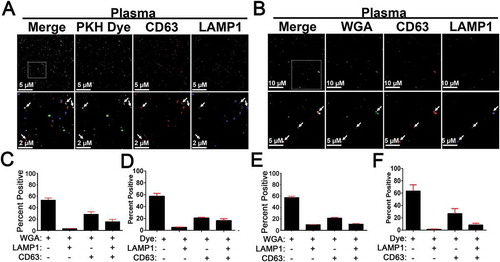
Figure 9. EV-MAC of Concentrated EVs Isolated from Plasma and Saliva. Concentrated EVs from plasma were bound to glass coverslips via spinoculation onto poly L lysine coated coverslips and stained with antibodies against CD63 and LAMP1 as well (a) 200 nM PKH67 or biotin conjugated wheat germ agglutinin (WGA) (b). Insets defined by the box in the merged image include arrows to indicate areas of colocalization between these markers EV-MAC localization of CD63 and LAMP1 was calculated for plasma samples stained with (c) PKH67 or (d) WGA and EVs isolated from saliva and stained with (e) PKH67 or (f) WGA. Data averaged from three or more technical replicates of the same sample; error bars are reported as standard error of the mean.