Figures & data
Table 1. Clinical Characteristics of study subjects in the discovery and validation set.
Figure 1. Validation of EV sample quality.
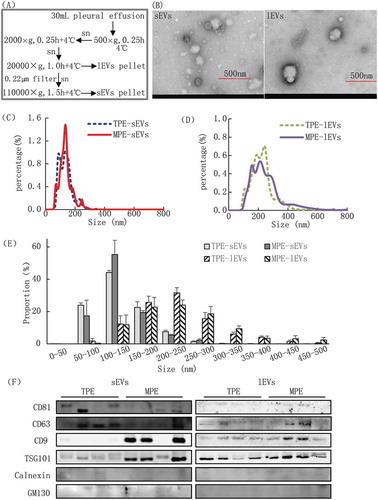
Figure 2. Characterization of metabolic profiles from samples of lEVs, sEVs, and pleural effusions (PFs).
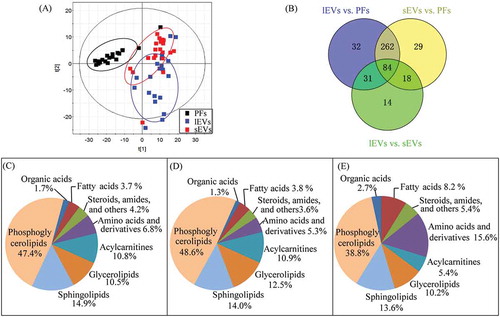
Figure 3. Enrichment of metabolites in lEVs and sEVs compared to pleural effusions (PFs).
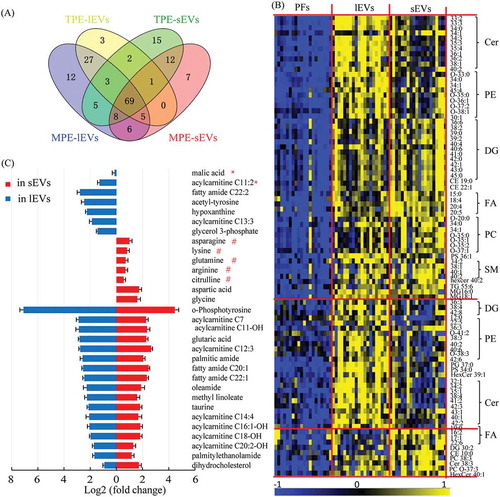
Figure 4. Differential metabolites in comparison of TPE and MPE from samples of lEVs and sEVs.
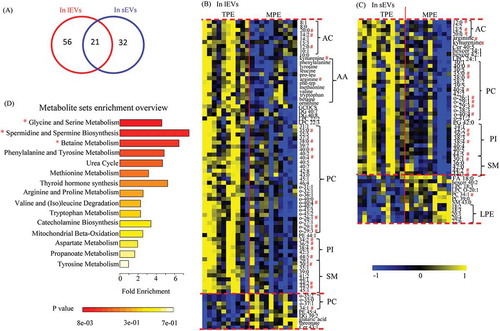
Figure 5. Network of interactions between clinical parameters and differential metabolites identified in sEVs (A) and in lEVs (B) subgroups.
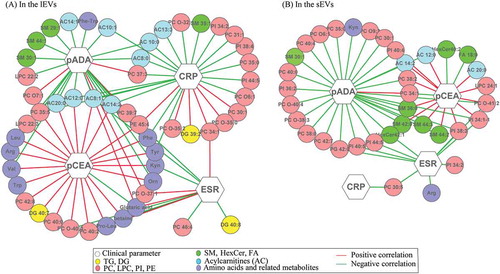
Figure 6. Identification of metabolic biomarkers candidates for distinguishing TPE and MPE in lEVs.
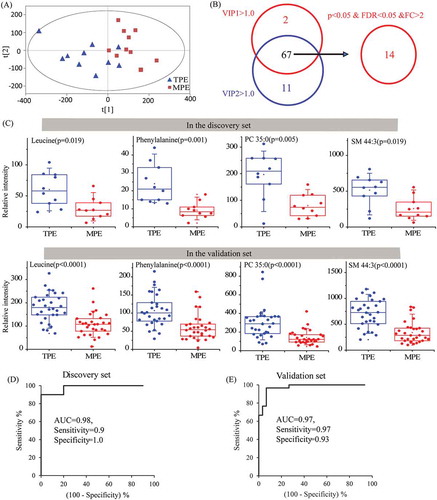
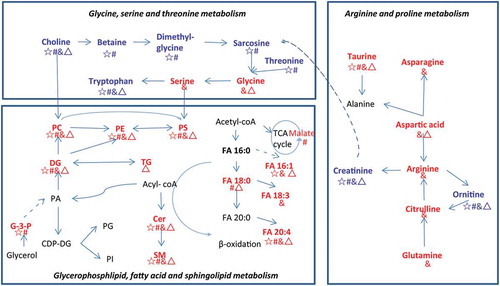
Figure 7. Metabolic pathways of differential metabolites between EVs and pleural fluid.