Figures & data
Figure 1. Comparison of EV isolation by PEG precipitation or UC. EV were collected from equal volumes of blood. For PEG precipitation, 250 µL of 1:1 diluted plasma was mixed with an equal volume of 20% PEG. For UC, 250 µL of 1:1 diluted plasma was first diluted further with 4 mL PBS. Pellets were resuspended in PBS. (a), total protein was determined by BCA (expressed as mg/mL originating plasma; mean ± SD, n = 3). (b), the concentration of particles as detected by NTA (particles/mL originating plasma; mean ± SD, n = 3). (c), size distribution of particles detected in B (representative for n = 3). Particle size at peak optimum is indicated. (d and e), protein was collected either by centrifugation after incubation with PEG for the time indicated, or by UC. PEG and UC samples were normalised to equivalent volumes of originating plasma, or, where indicated, 2.5 × concentrated. Molecular weight markers are indicated on the left in kDa. (d), samples were analysed by SDS-PAGE followed by Sypro ruby total protein staining. (E), the same samples were analysed by Western blotting for the presence of the EV markers CD9 or CD81, the LDL marker apoB100, or the HDL marker apoA1. Experiment shown is representative for 3 independent experiments. (f), Whole amount TEM images of particles collected by either PEG precipitation or UC. Due to the high concentration of particles, PEG pellets were resuspended in 10 × higher volume of PBS than UC pellets. Scale bars, 100 nm. Arrows indicate EV, arrowheads exemplify some of the many lipoprotein particles.
Figure 2. Fractionation of UC isolates in iohexol density gradients. EV were collected by UC of a diluted equivalent of 2 mL plasma, loaded at the bottom of the gradient and separated during 16 h centrifugation at 200,000 × gmax. Fractions were collected from the top and analysed by Western blotting for the presence of CD9, CD63, apoA1, and apoB100 (a), BCA for protein quantification (b), and SDS-PAGE followed by total protein staining using Sypro ruby (c). Molecular weight markers are indicated on the left in kDa. (d), Particles from the indicated gradient fractions were adsorbed to grids and analysed by TEM. White bars indicate 200 nm, black bar in the enlarged insert indicates 100 nm. In fractions 5 and 6, EV are indicated by arrows, while lipoprotein particles are exemplified by arrowheads. Note the many small electron lucent lipoprotein particles in fractions 2 and 9. All data are representative for 3 independent experiments.
Figure 3. Fractionation of PEG precipitates in iohexol density gradients. (a and b), For PEG precipitation, 250 µL of 1:1 diluted plasma was mixed with an equal volume of 20% PEG, and aggregates collected by low speed centrifugation, resuspended, and loaded on the bottom of iohexol density gradients. The gradients were centrifuged as indicated for either 4, 16, or 64 hr. Fractions were collected from the top of the gradients (left) and analysed by SDS-PAGE followed by Sypro ruby for total protein staining (a), or by Western blotting for detection of CD9, apoA1 and apoB100 (b). Molecular weight markers are indicated on the left in kDa. (c, d, e and f), after 1 hr incubation with PEG, aggregates in diluted equivalents of 1 mL plasma were collected by low speed centrifugation, resuspended, and loaded on the bottom of iohexol density gradients. The gradients were centrifuged for 16 hr, and gradient fractions were analysed by Western blotting for CD9, CD81 and CD63 (c), total protein in mg/mL plasma (d), SDS-PAGE followed by Sypro ruby for total protein staining (e), and TEM (f). White bars, 200 nm; black bars in the enlarged inserts, 100 nm. Note the abundance of EV indicated by arrows in fractions 5 and 6, relative to presumable lipoprotein particles (as exemplified by arrowheads), and the predominant presence of electron lucent lipoprotein particles in fractions 1 and 8. The very large lipoprotein particles in fraction 3 (asterixis) may represent chylomicrons. All data are representative for 3 independent experiments.
Figure 4. Fractionation of PEG precipitates by SEC. For PEG precipitation, 2 mL of 1:1 diluted plasma was mixed with an equal volume of 20% PEG. Aggregates were collected by low speed centrifugation, resuspended, and fractionated on a Sepharose CL-2B column. Total protein was determined by BCA (a) and SDS-PAGE followed by Sypro ruby staining (b), the presence CD9, CD63, apoA1, and apoB100 by Western blotting (c). Molecular weight markers are indicated on the left in kDa. (d), TEM images of EV in SEC fractions 9 and 10. Scare bars, 100 nm. Arrows indicate EV, arrowheads exemplify presumable lipoprotein particles. All data are representative for three independent experiments.
Figure 5. Fractionation by SEC after PEG precipitation and iohexol density gradient fractionation. For PEG precipitation, 2 mL of 1:1 diluted plasma was mixed with an equal volume of 20% PEG. Aggregates were collected by low speed centrifugation, resuspended, and loaded at the bottom of an iohexol density gradient. After 16 hr centrifugation, EV containing fractions were pooled and applied onto a Sepharose CL-2B column. SEC fractions were analysed by SDS-PAGE followed by Sypro ruby staining for total protein (a), and by Western blotting for the presence of CD9, CD63, apoA1 and apoB100 (b). Molecular weight markers are indicated on the left in kDa. (c), TEM images of particles in the indicated SEC fractions. White bars, 200 nm; black bar in the enlarged insert, 100 nm. EV are indicated by arrows, lipoprotein particles are exemplified by arrowheads. Fraction 18 shows lipoprotein particles only. These data are representative for 3 independent experiments. (d), Cryo-EM analysis of SEC fraction 10. EV (arrows), and one lipoprotein particle (arrowhead) are indicated. Scale bars, 100 nm. Black dots represent 5 nm gold particles that were spiked in for the purpose of image tracking. White asterisks point areas of the supporting carbon net. (E), Size distribution of randomly encountered EV by cryo-EM as in D.
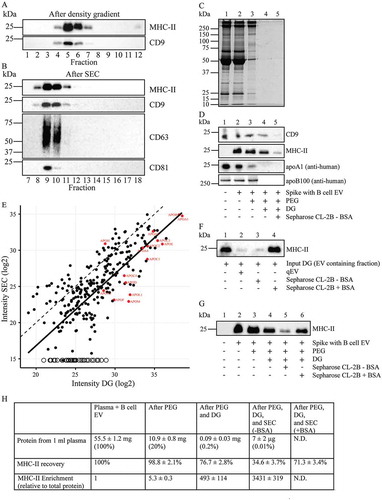
Figure 6. EV enrichment and recovery. (A, B, C and D), For PEG precipitation, 2 mL of 1:1 diluted plasma was spiked with EV isolated from 100 mL B cell culture medium, which are highly enriched for MHC-II. EV were then isolated from the spiked plasma by PEG precipitation, followed by floatation into iohexol gradients, and then SEC. (a), Fractions from the iohexol density gradients were analysed by Western blotting for the presence of the B cell EV specific marker MHC-II and the plasma EV specific marker CD9. (b), Fractions after SEC were analysed by Western blotting for the presence of MHC-II, CD9, CD63 and CD81. For each sequential isolation step, the recovery of total protein was monitored by SDS-PAGE (c) and for CD9, MHC-II, apoA1 and apoB100 by Western blotting (d). Samples from non-spiked plasma (lanes 1), plasma spiked with B cell EV (lanes 2), PEG precipitates (lanes 3), pooled EV containing iohexol density gradient fractions (lanes 4), and pooled EV containing SEC fractions (lanes 5) were all normalised to reach the same input relative to plasma. MHC-II was undetectable in non-spiked plasma, while CD9 could not be detected on B cell derived EV (not shown) and hence was not enhanced in spiked plasma. The quantification for recovery of MHC-II was determined for each step of the isolation procedure and is depicted in Fig. 6 H. (e), Scatterplot of the relative intensities of proteins detected by LC-MS/MS in EV containing density gradient fractions (DG) and after SEC (for their identity see Supplementary Table 1). The in red coloured named dots represent apolipoproteins (see also Supplementary Table 2), the open circles represent proteins that were undetectable after SEC and presumably not associated with EV (see Supplementary Table 1). The dotted line Y = X would represent quantitative retrieval. The solid line is generated by linear regression analysis for all proteins except apolipoproteins and those proteins that were not detected after SEC, and is indicative for 8.4 fold loss of EV due to non-specific binding of EV to the SEC column. (f), EV from 100 mL B cell culture media were isolated by UC followed by iohexol density gradient (DG) centrifugation and SEC, either using a qEV column or a Sepharose CL-2B column that was equilibrated and eluted in the absence or presence of access BSA, as indicated. After SEC, EV containing fractions were pooled and normalised to the input, and analysed by Western blotting for MHC-II. (g), EV were isolated from plasma spiked with B cell EV by PEG precipitation followed by iohexol density gradient fractionation and SEC using Sepharose CL-2B columns that were equilibrated and eluted either in the absence or presence of 1 mg/mL BSA. For each sequential isolation step, the recovery of MHC-II was monitored by SDS-PAGE and Western blotting using normalised samples, as indicated. Molecular weight markers are indicated on the left in kDa. All data are representative for 3 independent experiments. (H), Recovery and enrichment of EV from plasma after PEG precipitation, subsequent iohexol gradient fractionation and SEC. Total isolated protein was determined by BCA and is expressed as mg/mL originating plasma (±SD, n = 3). Recovery of MHC-II was determined by quantification of Western blotting signals as in Fig. 6D, and is expressed as percentage relative to the signal in originating plasma spiked with EV from B cells (mean ± SD, n = 3). Enrichment of MHC-II carrying EV was calculated relative to total protein in the same fraction (mean ± SD, n = 3). Enrichment could not be determined after SEC in the presence of BSA due to the excess of BSA (N.D.).