Figures & data
Figure 1. A schematic to show the various experiments and analyses performed to characterize the properties and biological effects of extracellular vesicles (EVs) derived from human induced pluripotent stem cells (hiPSCs). Human neural stem cells (hNSCs) were generated through the expansion of the hiPSCs in a chemically defined medium and expanded through serial passaging using an NSC proliferation medium (top panel). The various cartoons on the left illustrate the methods employed for the isolation and characterization of extracellular vesicles (EVs) from the spent media of passage 11 (P11) hNSC cultures. The methods include anion-exchange chromatography (AEC) and size exclusion chromatography (SEC) for EV isolation, ELISA and Western blotting (WB) studies on EV markers such as CD63, CD9 and ALIX and the deep cellular marker GM130, transmission electron microscopy (TEM) studies on EV morphology, evaluation of the size of EVs using NanoSight, and identification of small miRNAs and proteins using small RNA sequencing and proteomic analyses. The panels on the right show different experiments that examined the biological properties of EVs. First, the anti-inflammatory activity of EVs was measured through a macrophage assay in vitro with lipopolysaccharide exposure and quantification of interleukin-6 (IL-6) release. Next, the proficiency of EVs to target neurons, microglia and astrocytes in various regions of the brain in both rats and mice were examined 6 hours after an intranasal (IN) administration of PKH26-labelled EVs. Then, the anti-inflammatory activities of EVs in vivo was determined through quantification of various cytokine/chemokine in a mouse model of status epilepticus (SE). SE was induced through an intraperitoneal injection of pilocarpine. Finally, the neurogenic effects of IN administered EVs were evaluated via quantification of hippocampal neurogenesis in 6 months old rats. BrdU, 5ʹ-bromodeoxyuridine; DCX, doublecortin; GCL, granule cell layer.
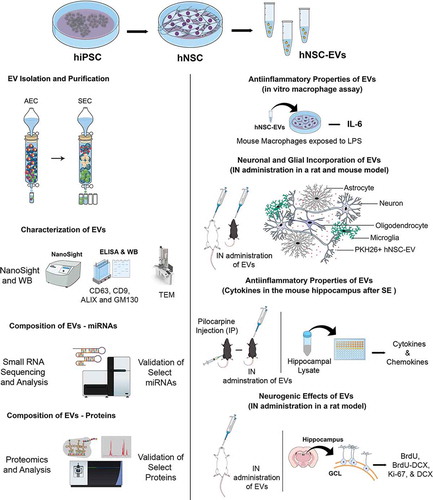
Figure 2. Human neural stem cells (hNSCs) express specific markers, and extracellular vesicles (EVs) isolated from hNSC cultures express multiple EV markers. (a1-a4) illustrate that all cells in the passage 11 hNSCs derived from human induced pluripotent stem cells (hiPSCs) express NSC markers nestin and Sox-2. Scale bar: 100 μm. (b) compares protein concentrations (the left Y-axis), and the concentration of EVs (the right Y-axis) in different EV fractions (X-axis) collected from size-exclusion chromatography (SEC). Note that fractions 5–9 contain most EVs with minimal protein content. (c). Representative graph from NanoSight analysis showing the size of EVs. (d, e and f) Illustrate a linear relationship between the number of EVs and the total protein (D), the protein-lipid ratio in EVs (E) and CD 63 protein content measured through ELISA (F). (g) shows the presence of ALIX and CD9 in EVs evaluated through Western blotting. The figure also indicates the absence of a deep cellular marker GM130 in hNSC-derived EVs, in contrast to its robust presence in the NSC lysate. Figure H shows the EVs of different size and shape visualized through transmission electron microscopy. Scale bar, 50 nm.
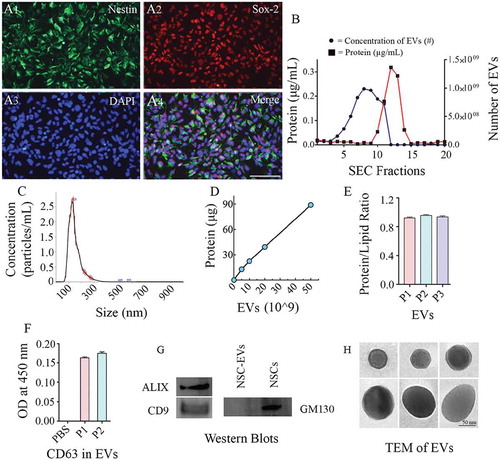
Table 1. Enriched KEGG pathways with functional categories. Relevant to the central nervous system.
Figure 3. Small RNA-Sequencing showed a comparable composition of small RNAs in three different preparations of human neural stem cell-derived extracellular vesicles (hNSC-EVs). The pie charts in figure (a) depict fractions of various small RNAs in three different preparations of hNSC-EVs (P1-P3). The Volcano plots in (b) compare the composition of small RNAs between different EV preparations. Note that the composition of small RNAs is mostly similar in three different preparations of hNSC-EVs. The bar chart (c) shows Ct values of miRNAs (miRs- 320a, 103a-3p, 21–5p, 26a-5p, 320b, 30a-3p, 181a-5p, 191–5p) validated through real-time quantitative PCR.
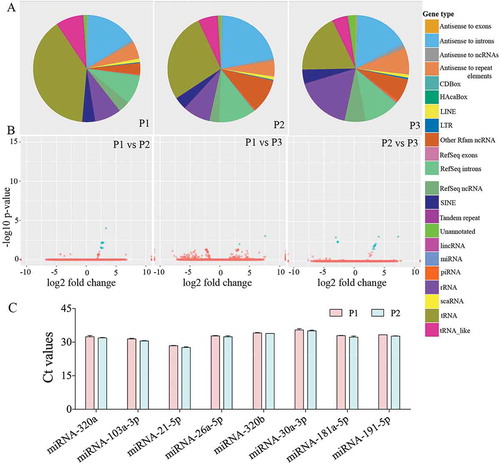
Figure 4. The results of pathway enrichment analysis on the top 40 most abundant miRNAs found in extracellular vesicles (EVs) derived from human neural stem cell-derived extracellular vesicles (hNSC-EVs). The figure shows the heatmap for the top 40 miRNAs in EVs versus KEGG pathways. The heatmap was calculated based on p values and the colour gradient depicts the significance of the interaction between miRNAs and pathways, where red squares mean the lowest p value and light-yellow squares imply a non-significant p value.
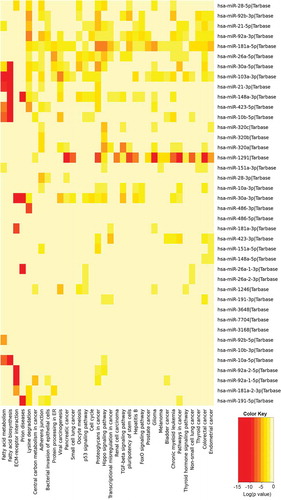
Table 2. Common EV-specific proteins identified by mass spectrometry analysis.
Table 3. 25 most relevant pathways over-represented in reactome analysis.
Figure 5. The results of Gene Ontology (GO) analysis of proteins found in extracellular vesicles (EVs) derived from human neural stem cell-derived extracellular vesicles (hNSC-EVs). Figure (a) is a Venn diagram showing that out of 1,086 proteins detected in the hiPSC-NSC-EV preparations, 1,059 overlapped with the proteins in Vesiclepedia database. Figure (b) shows the involvement of EV-associated proteins in molecular, cellular and biological processes. The bar charts in C-G illustrate EV-associated proteins agrin (c), pentraxin 3 (d), hemopexin (e), galectin-3 binding protein (Gal-3BP; f), and nidogen-1 (g), validated through quantitative ELISAs.
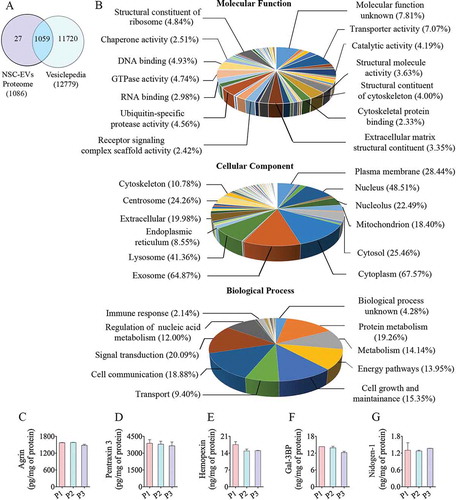
Figure 6. Extracellular vesicles (EVs) derived from human neural stem cells (hNSCs) display anti-inflammatory properties, and pervasively permeate the brain following an intranasal administration. Figure A shows data from the macrophage assay. LPS, lipopolysaccharide; DEX, dexamethasone; EVs, extracellular vesicles. Note that the addition of hNSC-EVs to LPS stimulated macrophage cultures resulted in a dose-dependent suppression of interleukin-6 (IL-6) release by macrophages, implying an anti-inflammatory effect. The effect was significant when 4 × 10⁹ or more EVs were added to macrophage + LPS cultures (a). ****, p < 0.0001. Figures (b1–b6) show that an intranasal (IN) administration of hNSC-EVs after 2 hours of acute seizure activity (a mouse model of status epilepticus) is adequate for reducing the concentration of multiple cytokines in the hippocampus. The cytokines that showed significant reductions following hNSC-EV treatment include the tumour necrosis factor-alpha (TNF-α; B1), interleukin-1 beta (IL-1β; B2), interferon-gamma (IFN-γ; b3), monocyte chemoattractant protein −1 (MCP-1; b4), leptin (b5) and the platelet-derived growth factor (PDGF-BB; b6). hNSC-EV treatment also normalized the anti-inflammatory protein IL-10 after status epilepticus (b7). Figures c1 and c2 show that normalization of TNF-α and IL-1β found through cytokine array following EV treatment could also be confirmed with individual ELISA. *p < 0.05, **p < 0.01, ***p < 0.001. NS, not significant. Figures d1-d15 illustrate the incorporation of PKH-26 labelled hNSC-EVs (red dots) by different cells in various regions of the rat brain at 6 hours after an IN administration. The figures illustrate NeuN+ neurons (d1-d5), calbindin+ Purkinje neuron (d6), IBA-1+ microglia (d7-d12) and astrocytes positive for GFAP (d13), S-100β (d14) or both GFAP and S-100β (d15). Figures e1-e12 illustrate the incorporation of PKH-26 labelled hNSC-EVs (red dots) by NeuN+ neurons (e1-e6) and IBA-1+ microglia (e7-e12) in various regions of the mouse brain at 6 hours after an IN administration. mPFC, medial prefrontal cortex (d1, d7, e1, e7); SSC, somatosensory cortex (d2, d8, e2, e8); DG, dentate gyrus (d3, d9, e3, e9); CA1 subfield (d4, d10); CA3 subfield (d5, d11, e4, e10); CBM, cerebellum (d6, d12); thalamus (e5, e11); and amygdala (e6, e12). Scale bar: 25 μm.
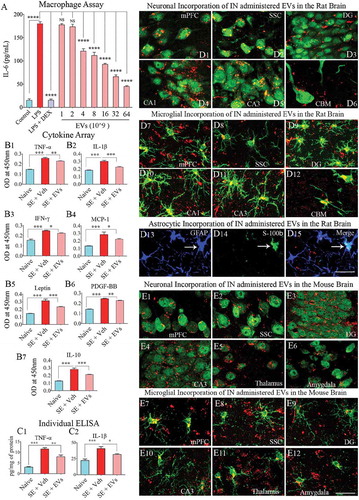
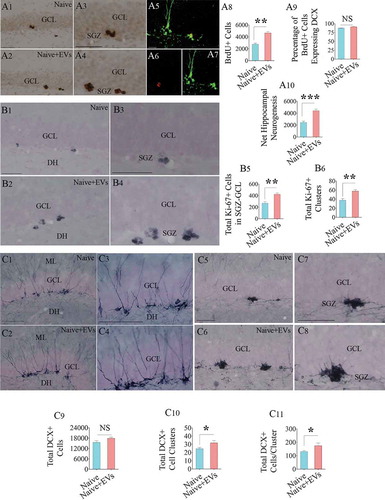
Figure 7. Intranasal administration of extracellular vesicles (EVs) derived from human neural stem cells (hNSCs) into adult rats increased the production of newly born neurons in the hippocampus. Figures a1-a4 show the distribution of 5ʹ-bromodeoxyuridine-positive (BrdU+) newly born cells from a naïve rat (a1) and a rat that received hNSC-EVs (a2). Figures a3 and a4 are magnified views from a1 and a2. Figures a5-a7 show examples of newly born neurons that express both BrdU (red, A5-A6) and doublecortin (DCX, green in A5 and A7). The bar charts in a8-a10 show that EV administration to adult rats increased the number of newly born cells (a8), had no effects on neuronal differentiation of newly born cells (a9) and enhanced net hippocampal neurogenesis (a10). Figures b1-b4 show the distribution of Ki-67+cells (i.e., proliferating cells) in the subgranular zone (SGZ) of a naïve rat (b1) and a rat that received hNSC-EVs (b2). Figures b3 and b4 are magnified views from b1 and b2. The bar charts in b5 and b6 show that EV administration to adult rats increased the number of proliferating cells in the SGZ (b5) with a higher number of Ki-67+ cell clusters (b6). Figures c1-c4 show the distribution of DCX+ neurons with vertical dendrites (relatively mature, newly born neurons) in the SGZ of a naïve rat (c1) and a rat that received hNSC-EVs (c2). Figures c3 and c4 are magnified views from c1 and c2. Figures c5-c8 show the distribution of clusters of DCX+ neurons with short dendrites (relatively immature, newly born neurons) in the SGZ of a naïve rat (c5) and a rat that received hNSC-EVs (c6). Figures c7 and c8 are magnified views from c5 and c6. The bar charts in c9-c11 show that EV administration to adult rats did not increase the number of total DCX+ neurons (c9) but increased the number of DCX+ immature neuron clusters (c10) and the number of DCX+ neurons/cluster (c11). *p < 0.05; **p < 0.01, ***p < 0.001; NS, not significant. Scale bar, a1-a4, b1-b4 and c1-c8 = 100 μm; a5-a7, 25 μm.