Figures & data
Figure 1. Characterization of brain EVs. (A) Representative western blots of the six fractions obtained after sucrose gradient centrifugation, from samples that were either passed through a 0.22 µm filter (filtered, sEVs) or not (non-filtered EVs). The total protein staining (TS, used as a loading control) shows a decrease in the total protein amount for the filtered samples. The cytosolic protein alix (96 kDa) and the membrane-bound proteins flotillin-1 (49 kDa) and CD81 (26 kDa), all considered as markers of EVs, were found in both cases mainly in fractions 3 and 4. The Golgi resident protein GM130 was used as a marker of non-EVs (negative control). (B) Representative transmission electron microscopy (TEM) images of pooled fractions 3 and 4 from non-filtered and filtered EVs. As seen for the TS in the western blot, the filtered fraction shows a decrease in EVs and a more uniform population. Scale bar represents 0.2 µm. (C) Confocal (green signal) and STED (red signal) images from pooled sEVs labeled with mCLING and the merge of both showing that, with high-resolution STED imaging, the blurry dots in the confocal correspond to single (or clusters of) EV particles. (D) Representative frames and concentration/size graphs from Nanoparticle Tracking Analysis (NTA) of pooled non-filtered and filtered EVs. Concentration (in particles/mL) and mean size (in nm) analysis of non-filtered pooled EVs (n = 3 preparations) and filtered pooled EVs (n = 4) show a significant reduction in concentration and mean size of EVs after filtration. Values are reported in the main text.
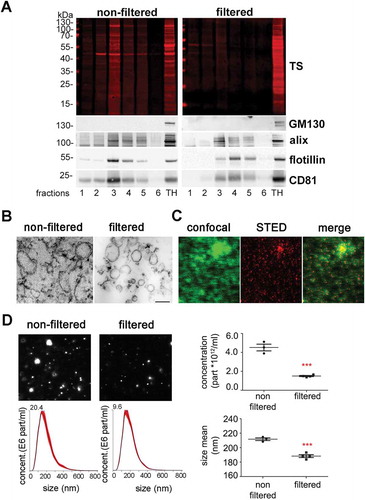
Figure 2. Differential quantitative proteome analysis of non-filtered versus filtered brain-derived EVs. (A) Heat map of the proteins identified by proteomics that were significantly different from non-filtered compared to filtered brain EVs. (B) Volcano plot showing the log2 fold-change on the x-axis and the statistical significance on the y-axis for proteins that were significantly differently abundant in filtered versus non-filtered brain EVs. The names of proteins that had a fold-change ≥ 2 are shown in the plot. (C) Pie charts showing the gene ontology analysis (GO) of Molecular Function for the proteins that were found to be significantly increased more than 1.5-fold (log2 more than 0.58) using the FunRich analysis tool. The five most representative pathways showing the percentage of proteins belonging to these pathways are shown. (D) Protein–protein interaction analysis (STRING database) of the proteins that were significantly upregulated in non-filtered and in filtered EVs (log2 more than 0.58). In order to create the network, a confidence score threshold of 0.9 (very high) and no text-mining options were selected. KEGG pathways obtained by this analysis are shown for each group.
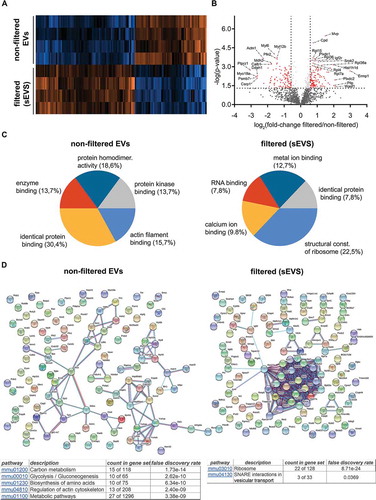
Figure 3. Microglia cells are the main contributor to the physiological brain sEV pool. (A) Representative western blots of pooled fractions 3 and 4 of filtered EVs (sEVs; n = 4) compared to their respective total brain homogenates (TH). P2Y12 and TMEM119 were chosen as markers of microglia, PLP and CNP as markers of oligodendrocytes, synapsin1 and SNAP-25 as neuronal markers, and EAAT1 (GLAST) and EAAT2 (GLT-1) as markers of astrocytes. Of note, TMEM119 presented a lower band (at around 20 kDa) in the sEVs-enriched fractions instead of the reported 60 kDa band (approx.) observed in the TH. This could correspond to an isoform or a truncated version of TMEM119. (B) Scatter plots showing relative intensity quantifications of each cell type marker. Each lane was first referred to its total protein staining (TS) signal and the means of each group (sEVs vs. TH) were then compared in order to check for relative enrichment (with TH set to 100%). P2Y12 and TMEM119 are approximately 2.5 and 1.5 times enriched in sEVs compared to the TH, indicating a dominant contribution from microglia to the whole pool of brain sEVs. Synapsin1 and SNAP-25 are significantly decreased compared to the TH, suggesting a low contribution of neuronal sEVs to the total pool. PLP, CNP, EAAT1 and EAAT2 did not show any significant differences compared to the TH. Exact mean, SEM and p-values are given in the main text.
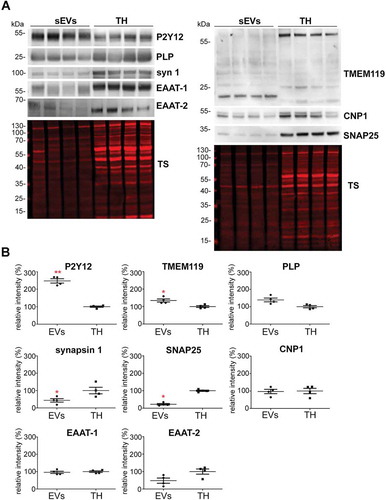
Figure 4. Brain EVs are enriched in PrP and its C1 fragment. (A) Representative western blots of the six fractions obtained after sucrose gradient centrifugation of non-filtered (EVs) and filtered EVs (sEVs) probed with POM1 antibody. A total homogenate (TH) was loaded for comparison. Note that PrP in the TH presents with a prominent diglycosylated full-length band (fl-PrP) at 43 kDa followed by two lowerbands, corresponding to mono- and unglycosylated PrP, respectively. In EVs, a major band at 34 kDa is presented which could either correspond to unglycosylated fl-PrP or to its diglycosylated truncated C1 fragment (PrP-C1). (B) Representative Western blots of EV fractions 3 and 4 treated (+) or not (-) with PNGase F and probed with POM1 and total protein staining (TS). The PNGase digestion reveals that the major band at 34 kDa present in the EVs corresponds to the C1 fragment (marked with an asterisk). (C) Representative Western blots of pooled sEVs (n = 4) compared to their respective total brain homogenates (TH) probed with POM1 and total protein staining (TS). (D) Scatter plot showing the quantification of the comparison between total PrP in the TH versus sEVs. PrP shows a significant twofold increase in sEVs relative to the TH. Each lane was first referred to its total protein staining and then the means for total PrP in sEVs and TH were compared. The mean, SEM and p-values are stated in the main text.
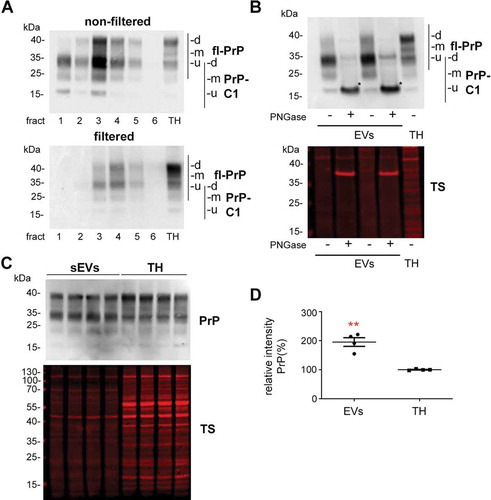
Figure 5. Contribution of astrocytes to the brain sEV pool is upregulated and PrP levels on brain sEVs are increased 24 h after tMCAO. (A) Representative western blots of sEVs from sham mice (n = 8) and mice that underwent the tMCAO procedure (n = 8). Blots show the total protein staining (TS) and cell type-specific surface markers: PLP for oligodendrocytes, P2Y12 for microglia, synapsin1 for neurons, and EAAT1 for astrocytes. On the right, scatter plots of relative intensity quantifications show a significant increase of the astrocytic marker EAAT1 in tMCAO sEVs compared to sham sEVs. PLP, P2Y12 and synapsin1 were not significantly changed. For quantification each lane was first referred to the TS and then the mean values of the two experimental groups were compared. (B) Representative western blots of sEVs from sham (n = 8) and tMCAO mice (n = 8) probed with POM1 antibody and total protein staining (TS). On the right side, scatter plot of relative intensity quantifications showing an increase in total PrP in tMCAO sEVs compared to sham sEVs. The mean, SEM and p-values are reported in the main text.
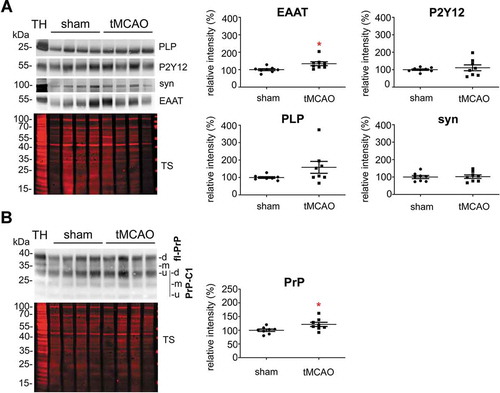
Figure 6. PrP influences brain sEVs uptake by primary neurons. (A) Representative confocal microscopy images of primary neurons from WT mice in high-density culture (HDC) incubated for 1 h with sEVs isolated from either WT (WT-sEVs) or Prnp0/0 mouse brains (PrP-KO-sEVs) and labelled with mCLING dye. Small EVs signals are shown in white. Neurons were stained with phalloidin (green; to visualize F-actin), the lysosomal marker LAMP-1 (red), and with DAPI (blue; to visualize the nucleus). Note that after 1 h of incubation, WT-sEVs present with a weak and rather diffuse staining at the neuronal plasma membrane, whereas PrP-KO-sEVs show a dotty staining at the neuronal plasma membrane with some PrP-KO-sEVs being present inside the neuronal cell body (yellow arrow). In this HDC condition, other cell types (apparently microglia based on their morphology in culture) were observed to take up a few WT-sEVs, yet conspicuously much higher amounts of PrP-KO-sEVs. (B) Representative confocal images of low-density culture (LDC) primary neurons from WT mice incubated for 1 h with sEVs isolated from WT (WT-sEVs) or PrP-KO mouse brains (PrP-KO-sEVs) labelled with mCLING as in (A). Here again, PrP-KO-sEVs (showing a distinct dotty pattern inside neurons) are taken up more readily than WT-sEVs. Cells presumed to be microglia cells (see also ) showed a similarly strong engulfment pattern for sEVs from PrP-KO brain as in (A). Scale bar is 5 µm. (C) Scatter plot showing intensity of sEVs quantification in high-density (HDC, on the left) and low-density primary neuronal cultures (LDC, on the right). PrP-KO-sEVs are significantly more taken up by neurons after 1 h than WT-sEVs. The mean, SEM and p-values are given in the main text.
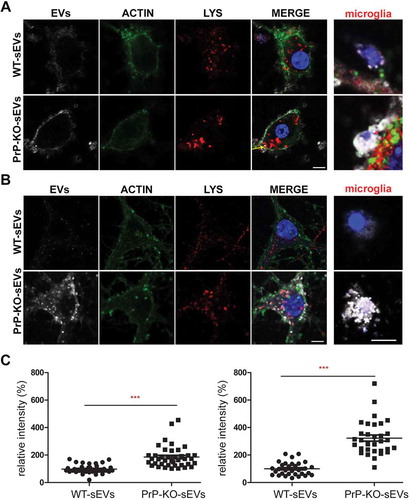
Figure 7. PrP also affects the uptake of brain-derived sEVs by microglia and astrocytes. (A)Confocal microscopy images confirming that the non-neuronal cells observed in our HDC and LDC neuronal cultures from WT mice () are indeed microglia, as they stain positive for IBA1. As in , sEVs are labelled with mCLING and shown in white. DAPI (in blue) is used as a nuclear staining. (B) Representative FACS plot of astrocytes (GLAST+) and microglia (CD11b+) from mixed cultured primary glia cells (n = 4). Mixed glia cells from WT mice were incubated for 3 h with equal amounts of either WT-sEVs or PrP-KO-sEVs labelled with mCLING and analysed for sEVs uptake using flow cytometry. On the right side, histograms showing the intensity of the sEVs fluorescence measured from astrocytes or microglia. Note that in both cases the intensity (mCLING mean fluorescence intensity (MFI) shown in %, WT is set to 100%) is higher for PrP-KO-sEVs. (C) Bar scatter plots of normalized fluorescence intensity show that both, microglia and astrocytes, take up PrP-KO-sEVs more efficiently than WT-sEVs. The exact means, SEM and p-values are reported in the main text.
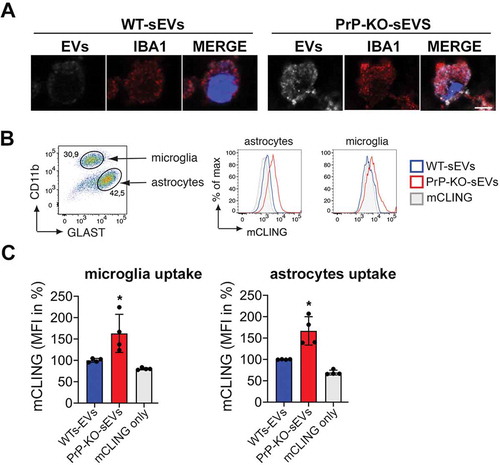
Figure 8. Brain-derived sEVs are found in lysosomes after 3 and 6 h of incubation. (A) Representative confocal microscopy images of primary neurons from WT mice (labelled with phalloidin, in green) in high-density culture (HDC) incubated for 3 h with WT-sEVs or PrP-KO-sEVs labeled with mCLING (white signal). The lysosomal marker LAMP-1 is shown in red and nuclei are stained with DAPI (in blue). Note that both, WT- and PrP-KO-sEVs, co-localize with LAMP-1, although we consistently observed a much higher level of colocalization for PrP-KO-sEVs. Instead, a rather diffuse mCLING staining at the membrane is found for cells treated with WT-sEVs. White arrows highlight sEVs located at the plasma membrane (PM), whereas yellow arrows indicate colocalization of sEVs with LAMP-1. Note that for WT-sEVs there are many sEVs found at the plasma membrane, whereas PrP-KO-sEVs much stronger colocalize with LAMP-1. (B) Representative confocal microscopy images showing primary neurons as in (A) but incubated with sEVs for 6 h. sEV identity and stainings as in (A). Note that after 6 h sEV-associated signals are mainly found in colocalization with lysosomes. Scale bar is 5 µm. (C) Scatter plots showing intensity quantifications of WT-sEVs and PrP-KO-sEVs in primary neurons at 3 h (on the left) and 6 h (on the right) of incubation in the HDC. As for 1 h (Figure 5), PrP-KO-sEVs are significantly more taken up by neurons than WT-sEVs. Mean, SEM and p-values are reported in the main text.
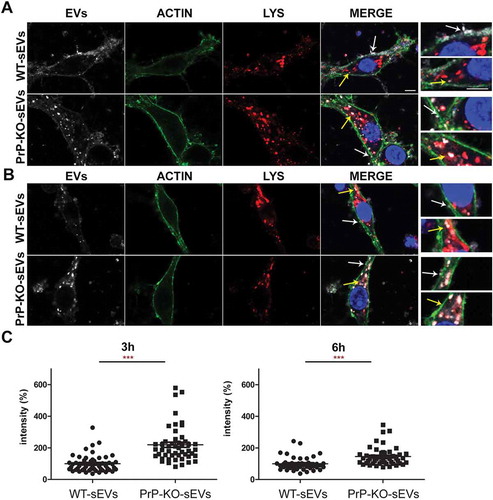
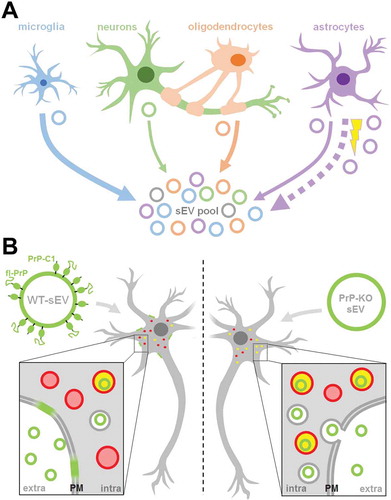
Figure 9. Summarizing scheme. (A) Schematic representation of the relative contribution of different brain cell types to the sEV pool in murine brain. Under physiological conditions, microglia appear to be the main contributor to the sEV pool, followed by oligodendrocytes and astrocytes, while neurons contribute relatively little (contribution indicated by thickness of solid arrows). Upon experimental stroke (indicated by the yellow thunderbolt), astrocytic release of sEVs is upregulated and astrocytes appear to be the main contributor 24 h after reperfusion (indicated by the bold dotted arrow). sEVs are depicted as circles and the color refers to their cellular origin. Note that a fraction of sEVs (grey) may also be released by other cell types not assessed here, such as pericytes or endothelial cells. (B) Differential uptake of WT-sEVs and PrP-KO-sEVs may be influenced by PrP. WT-sEVs (on the left) are packed with fl-PrP and its truncated C1 fragment ending with a stretch of hydrophobic amino acids. These sEVs are relatively slowly taken up by neurons and rather seem to fuse with the plasma membrane (PM). In contrast, sEVs lacking PrP (PrP-KO-sEV; on the right) are rapidly endocytosed and transported to lysosomes (red circles). Colocalization (i.e. lysosomes containing sEVs) is indicated in yellow. Similar observations have been made with microglia or astrocytes as recipient cells. Note that other surface proteins and cargo of sEVs, as well as the lipid bilayer of vesicles, lysosomes, and sEVs, are not depicted here to simplify matters.