
Figures & data
Table 1. List of biosimilars approved by the European Medicines Agency (as of March 2016) [Citation1].
Table 3. Selection of the 10 EU countries members of the Organisation for Economic Co-operation and Development (OECD) having the highest pharmaceutical expenditure [Citation23,Citation24].
Table 4. Analogue products considered in the study.
Table 5. Estimations of generic uptake versus off-patent market (volume) and generic discounts versus reference product used in the regression model.
Table 6. Overview of key incentive policies in the 10 selected EU countries for biosimilars (Con’t) (as of November 2015).
Table
Figure 1. Total 2014–2015 (Q1/Q2) sales in volume of biosimilar and originator products by country and by therapeutic classes.
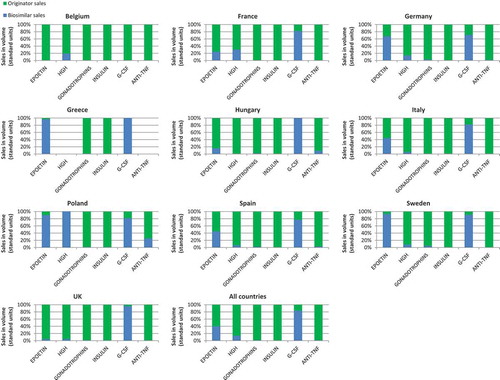
Figure 2. Average biosimilar price discount by country in (%) over originator products.
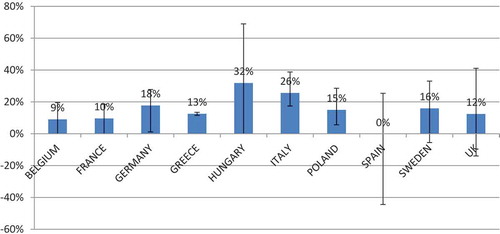
Table 7. Selected generalised linear model results.
Table 8. Date of entry in the EU and GDP per capita of 10 selected EU countries [Citation53,Citation63].