
Figures & data
Table 1. Number of OD approvals by therapeutic area.
Figure 1. Number of new OD approvals per year.
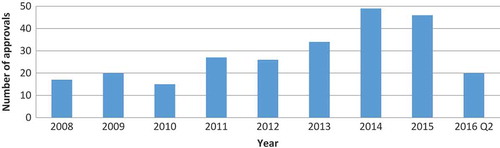
Figure 2. Cumulative number of FDA-approved ODs on the US market by year.
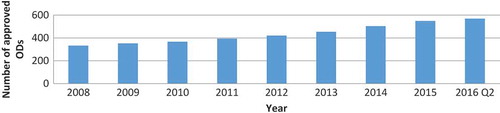
Figure 3. Yearly distribution of new OD shortages.
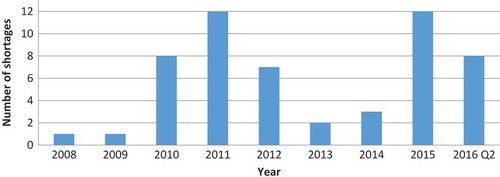
Figure 4. Number of active OD shortages in a given year (with a minimal shortage duration of one day).
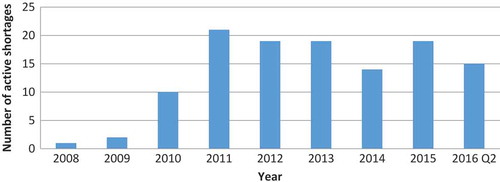
Figure 5. Percentage of ODs on the market that were in shortage in a given year for at least one day.
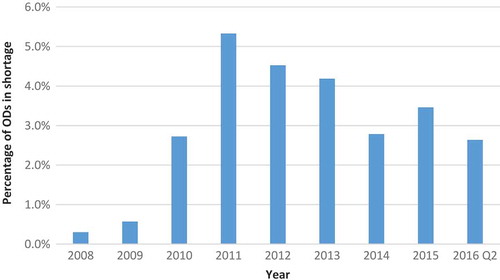
Figure 6. Duration of individual shortages starting in a given year. Note: Red bars indicateshortages unresolved at the date of data collection (13 June 2016).
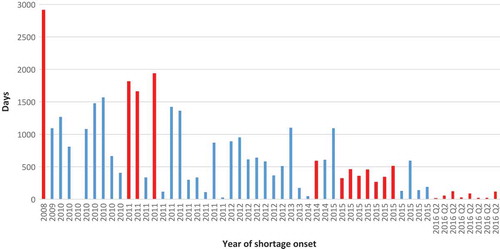
Table 2. Distribution of shortages among therapeutic areas.