
Figures & data
Table 1. First- and second-line anti TB drugs.
Figure 1. Markov model state structure.
Note: modified from [Citation14].
![Figure 1. Markov model state structure.Note: modified from [Citation14].](/cms/asset/bd6aa1da-a08b-4024-8f54-62e0f4e9325e/zjma_a_1283105_f0001_oc.jpg)
Table 2. Treatment efficacy reported in clinical literature.
Table 3. Model adaptation to the Italian setting: outcomes.
Table 4. Model adaptation to the Italian setting: costs.
Table 5. Base case cost-effectiveness analysis.
Figure 2. Cost-effectiveness acceptability curve for bedaquiline + BR versus BR: Italian NHS perspective.
BR = background regimens; BBR = bedaquiline plus background regimen.
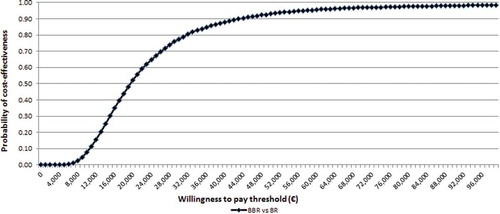
Figure 3. Cost-effectiveness acceptability curve for bedaquiline + BR versus BR: Italian societal perspective.
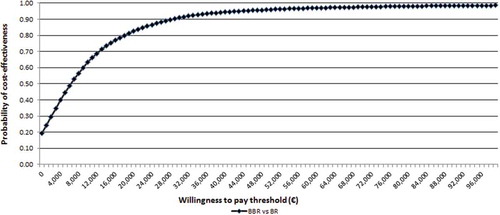
Table A1. Percentage of use and daily cost for drugs used in Italy as Background Regimens.
Supplemental material