6,399
Views
20
CrossRef citations to date
0
Altmetric
Original Research Article

A comparative study of orphan drug prices in Europe

, , & ORCID Icon
Article: 1297886 | Received 28 Nov 2016, Accepted 10 Feb 2017, Published online: 29 Mar 2017

Figures & data

Table 1. Orphan drugs (OD) HTA, pricing, reimbursement, and market access in major European countries.

Table 2. Number of comparable orphan drugs analysed per country.

Figure 1. Mean, median, minimum, maximum ratios per country using UK as reference.

Figure 1. Mean, median, minimum, maximum ratios per country using UK as reference.

Figure 2. Percentage of orphan drugs (OD) under four cost ratio categories.

Figure 2. Percentage of orphan drugs (OD) under four cost ratio categories.

Figure 3. Averaged ratios when the UK reference list was divided into four quartiles based on UK costs. Quartile 1 includes orphan drugs with the highest annual treatment costs in the UK and quartile 4 includes orphan drugs with the cheapest annual treatment costs in the UK.

Figure 3. Averaged ratios when the UK reference list was divided into four quartiles based on UK costs. Quartile 1 includes orphan drugs with the highest annual treatment costs in the UK and quartile 4 includes orphan drugs with the cheapest annual treatment costs in the UK.

Figure 4. Averaged ratios when the UK reference list was divided into eight disease areas.

Figure 4. Averaged ratios when the UK reference list was divided into eight disease areas.

Figure 5. Averaged ratios for top three disease areas with most orphan drugs available in the UK.

Figure 5. Averaged ratios for top three disease areas with most orphan drugs available in the UK.

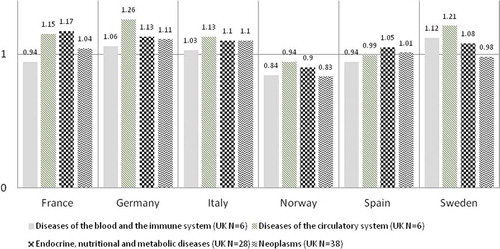
Table 3. Available literature on orphan drug prices in the EU.

Supplemental material