Figures & data
Figure 1. Classification of prevention.

Table 1. Vaccination extends beyond vaccine availability.
Table 2. Summary of the differences between vaccines and drug treatment.
Figure 2. Positioning an HTA programme within healthcare.
BI, budget impact; HE, health economics; HTA, health technology assessment; RCT, randomised controlled trial.
Adapted from Luce et al., 2010 [Citation36].
![Figure 2. Positioning an HTA programme within healthcare.BI, budget impact; HE, health economics; HTA, health technology assessment; RCT, randomised controlled trial.Adapted from Luce et al., 2010 [Citation36].](/cms/asset/0fb372e7-dbc2-453f-9a8e-4e4e26ec935e/zjma_a_1335162_f0002_oc.jpg)
Table 3. Programme of the National Immunisation Technical Advisory Group (NITAG) as developed in the Netherlands.
Table 4. Value assessment in economic evaluations.
Figure 3. Additional value characteristics and gains with vaccines.
QALY, quality-adjusted life-year; QoC, quality of care; AMR, antimicrobial resistance.
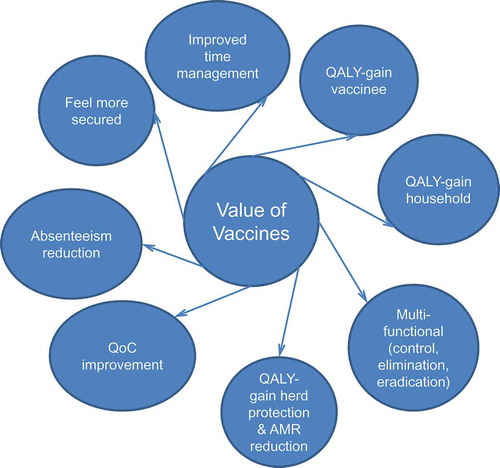
Table 5. Ranking different interventions in function of incremental QALY analysis or incremental cost–utility ratio for their selection with a threshold and/or a budget limitation (hypothetical case).
Figure 4. Incremental analysis (Line A) versus other threshold options (minimum health gain to be achieved – Line B, and individual level – Line C).
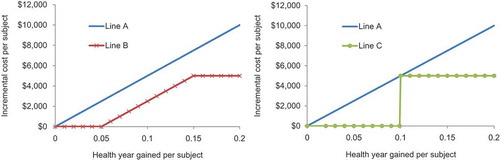
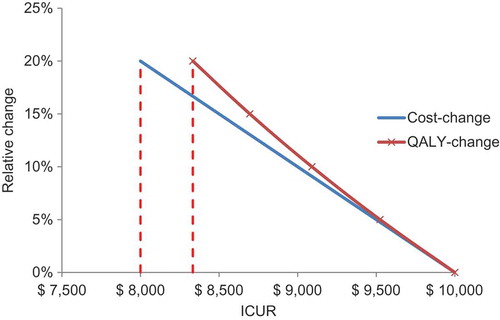
Figure 5. The relative change in cost- or quality-adjusted life-year difference on the incremental cost–utility ratio result.
ICUR, incremental cost–utility ratio; QALY, quality-adjusted life-year.