3,106
Views
10
CrossRef citations to date
0
Altmetric
Review Article

2. How is the economic assessment of vaccines performed today?

Article: 1335163 | Received 02 May 2017, Accepted 22 May 2017, Published online: 31 Aug 2017

Figures & data

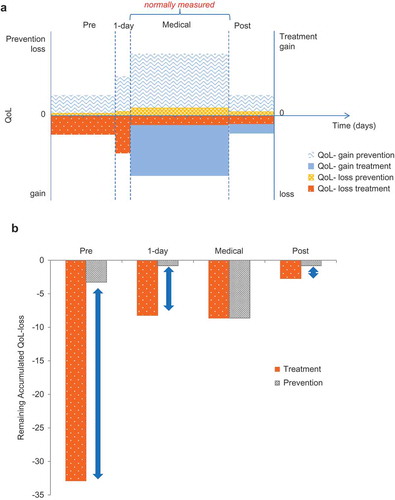
Table 1. Overall and specific evaluation under medical attention only; and comparison of QoL-loss avoided for a cohort of 100,000 subjects by specific treatment versus vaccine prevention (hypothetical example).

Figure 1. Comparison of treatment versus prevention: hypothetical example (a) Assessing the individual quality of life (QoL) gain or loss with prevention and treatment; (b) Impact difference between treatment and prevention at a population level (cohort of 100,000 subjects). QoL, quality of life

Figure 1. Comparison of treatment versus prevention: hypothetical example (a) Assessing the individual quality of life (QoL) gain or loss with prevention and treatment; (b) Impact difference between treatment and prevention at a population level (cohort of 100,000 subjects). QoL, quality of life

Figure 2. Schematic view of the different levels of vaccine benefit.

Figure 2. Schematic view of the different levels of vaccine benefit.

Figure 3. Incremental cost-utility ratio (ICUR) per QALY gained versus intervention cost (CostI) comparing treatment (blue line) versus vaccine (green line). ICUR, incremental cost-utility ratio; CostI, intervention cost; QALY, quality-adjusted life-years. (A) Cost-offset when two treatments are compared; (B) The difference in cost between the cost-neutral point (Cn1) and the cost where the line reaches the threshold (Cm1) for a treatment compared with another treatment; (C) Cost-offset when a vaccine is compared with a treatment; (D) The difference in cost between Cn2 and the cost where the line reaches the threshold (Cm2) for a vaccine compared with a treatment; T, threshold value.

Figure 3. Incremental cost-utility ratio (ICUR) per QALY gained versus intervention cost (CostI) comparing treatment (blue line) versus vaccine (green line). ICUR, incremental cost-utility ratio; CostI, intervention cost; QALY, quality-adjusted life-years. (A) Cost-offset when two treatments are compared; (B) The difference in cost between the cost-neutral point (Cn1) and the cost where the line reaches the threshold (Cm1) for a treatment compared with another treatment; (C) Cost-offset when a vaccine is compared with a treatment; (D) The difference in cost between Cn2 and the cost where the line reaches the threshold (Cm2) for a vaccine compared with a treatment; T, threshold value.

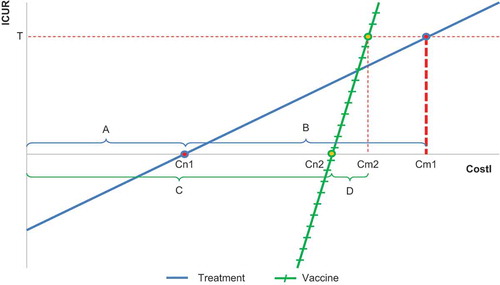
Table 2. Evaluation tools for assessing the economic value of vaccines.

Supplemental material

Supplemental_files.zip

Download Zip (78.5 MB)