Figures & data
Figure 1. Structure of the Markov model.
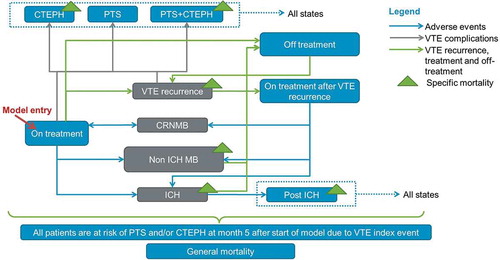
Table 1. Efficacy and safety inputs of edoxaban vs. warfarin, from the Hokusai-VTE clinical trial.
Table 2. Inputs for the base case analysis and ranges of values used for the deterministic sensitivity analysis.
Table 3. Model results for base-case and subgroups analysis.
Figure 2. Deterministic sensitivity analysis of the cost effectiveness of edoxaban vs. warfarin (the 10 most impactful parameters are shown).
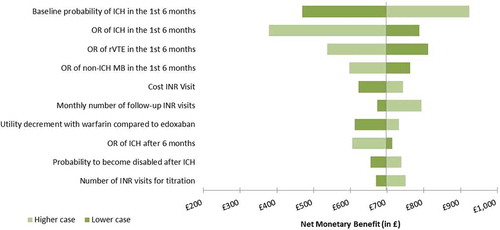
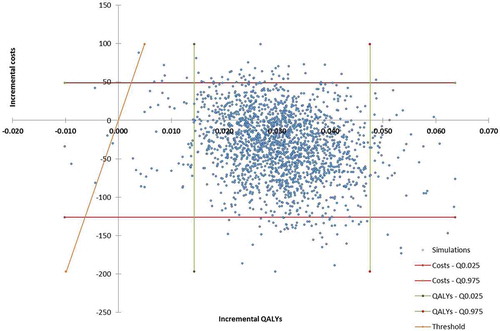
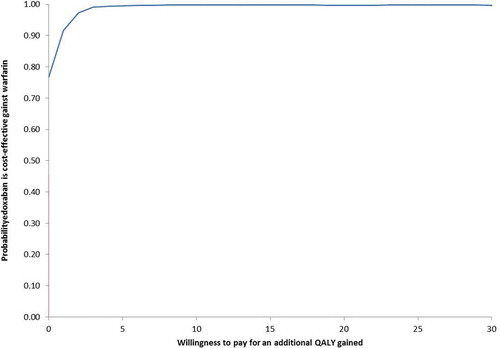
Figure 3. Incremental cost-effectiveness plane (a) and cost-effectiveness acceptability curve (b) of edoxaban vs. warfarin (n = 2,000 simulations).